
The Treasury paid down $78 billion in outstanding bill, note and bond supply in the period April 6 through May 11, thanks to its cash windfall from April tax collections. The Treasury collects more than it spends in April and May. It then uses some of that to pay down existing debt. Holders of the expiring paper get cash back. They then reinvest in other paper, both short and long term fixed income and equities.
At the same time, there’s less short term Treasury paper to buy, so cash rich dealers, banks, investors bid aggressively for the existing supply, pushing rates down. This happens every year in late April and early May. We usually also see stocks and bonds usually move up until perhaps the middle or end of May. By then the extra cash has been absorbed and the Treasury has used up its windfall and starts to increase borrowing again.
But this year, with the debt ceiling in place, that won’t happen. With new borrowing on ice, and cash still flowing into the US from money printed by the ECB and BoJ, that could be a lethal combo stock and bond bears over the next couple of months. As long as the Treasury can’t issue new supply, there won’t be enough paper around to absorb the buildup of cash. That should put extra buying pressure on all kinds of financial assets.
At least that’s the theory, and so far, the evidence in recent weeks has mostly been that the theory is holding up. I expect it to continue to hold up, but the technical analysis has told us that the upside will be limited and the move will be labored. I cover that end of the story in my Weekly Market Updates.
Treasury Bill Offerings
In T-bill auctions over the April 6-May 11 period, the Treasury paid down $45 billion in outstanding bills. The average bid to cover ratio fell from 3.4 on the maturing bills to 3.25 on the new bills. During March the average was 3.5. So we can see the effects of falling new supply while demand has increased. The average bid tendered rose from $102 billion per auction in March to $125 billion in April-May.
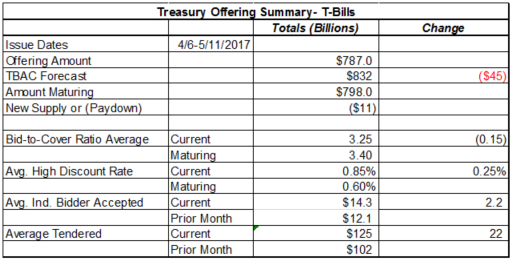
The average discount rate however rose from .60 basis points on maturing bills to .85 on new bills. That was in line with the Fed’s increase on the target rate for Fed Funds.
But wait, didn’t I just say that rates should be falling? Yes, but most investors and traders believe in the Fed’s magic wand, and were still acting as if the Fed’s March rate increase was real. With the reductions in Treasury supply quite small, the reality, the reality of all that excess cash around hadn’t quite hit home through the period covered by this data.
We must also keep in mind, the rate data is an average for the week period. In terms of time the average represents the half way mark of that period, or mid April. That was before the biggest supply reductions and just a couple of weeks after the Fed’s hocus pocus.
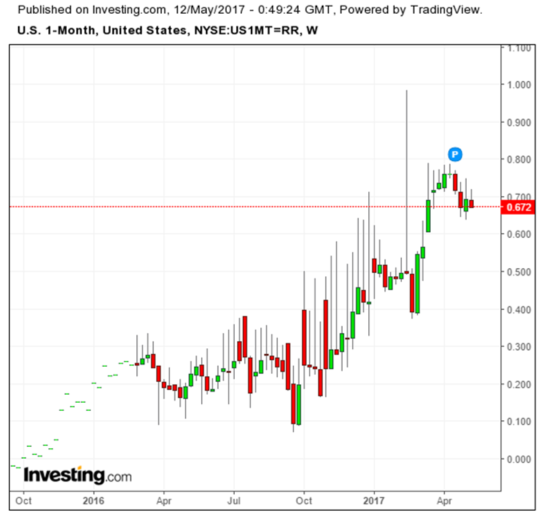
So when we look at the rate on the 4 week bill issued April 6, we see 76 basis points. By May 11, that bill had slipped to 71 bp. We can see rates starting to slip on the chart of the 4 week bill rate in the secondary money markets.
Treasury Coupon Offerings
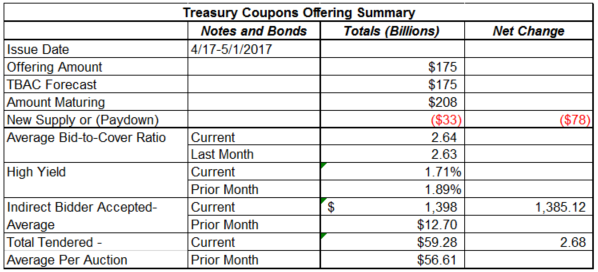
The Treasury paid down $33 billion in outstanding notes and bonds during April. That put cash back into the accounts of dealers, banks, and investors. This is a regular seasonal feature of the long term Treasury market late April and early May as tax collections flood in and the Treasury is temporarily flush with cash.
The Treasury pays down some debt with that cash. That not only puts more cash into the pockets of erstwhile holders of maturing debt, it also reduces the supply available for them to roll into. So it ends up putting upward pressure on all kinds of financial assets. The effect is temporary because the government starts pulling cash out of the market again in late May.
The debt ceiling problem reared its ugly head on the schedule for next week’s note and bond auctions. Mid month usually sees auctions of 30 year bonds, and 3 and 10 year notes. The TBAC forecast called for gross issuance of $62 billion against $50 billion in maturities for net issuance of $12 billion. It also called for a 10 year TIPS issue of $11 billion, all new money, to settle on May 31.
The announcement for the notes and bonds came out on Thursday, and lo and behold, the 3 and 10 year notes were not there. That’s $47 billion in expected supply that won’t be forthcoming. So instead of $12 billion in new supply, there will be a paydown of $35 billion in cash. That cash will go back to dealers, banks and investors and it will start burning holes in their pockets right away. The fires will only grow bigger as the amount of withheld supply grows.
This of course can’t go on forever. At some point the Treasury will run out of government pension funds to raid, and will either need to start borrowing again, or it will default. According to the Washington Post, the Bipartisan Policy Center forecasts the drop-dead date as October 2, when the government is required to make a huge once yearly payment to the military retirement trust fund.
Whether sooner or later than that, the time is coming when the Treasury will start borrowing again, and it will do so with a vengeance as it pays back all the internal funds it raided, and raises a little cash cushion on top of it. That’s when the real problems start. While it’s entirely possible that the markets could look crazy bullish for another couple of months, beware the Ides of August, or September, or October. At some point during that period, the papering over of the problems will end, and we’ll be faced with ugly reality.
This report is derived from Lee Adler’s Wall Street Examiner Pro Trader Monthly Treasury Supply and Demand Report.
Lee first reported in 2002 that Fed actions were driving US stock prices. The US Treasury has also played a role in directly moving markets. Lee has tracked and reported on those relationships for his subscribers for the last 15 years, helping to identify major turning points in the markets in their earliest stages. Try Lee’s groundbreaking reports on the Fed and the Monetary forces that drive market trends for 3 months risk free, with a full money back guarantee. Be in the know. Subscribe now, risk free!

