
The mainstream media parroted the NAR press release in reporting on Monday that “Pending Home Sales” hit their lowest level in the past 12 months. The report was false. It was based on seasonal adjustment, comparing monthly data which is wholly made up from arbitrary seasonal adjustment factors provided at the beginning of each year by the Commerce Department. These are subsequently revised as future years’ data becomes available. Obviously that data is yet to be known, so the initial seasonal adjustment is based on the patterns of the past 5 years alone. The result is that the data, which purports to represent the center of a trend, may or may not accurately represent the approximate behavior of the current month.
Consequently, I rely entirely on actual, not seasonally adjusted data (NSA). It can’t misrepresent because it is actual. We can ascertain the strength or weakness of the current reading by directly comparing it to the same month in past years, and by observing any change in the annual growth rate. We then put the data on a graph so that our brains can see and process it visually. This isn’t rocket science. It works better than trying to interpret a made up number that gets repeatedly revised in subsequent months and years when no one is paying attention to past releases any more. I say let’s look at the present actual number and get it right the first time.
Furthermore, Pending Home Sales are not an indicator of future activity, which is what the NAR tells us it is. They are a report of current contracts, which everybody involved in the transaction, and everybody in the industry, considers a sale. If they didn’t why do they put a SOLD sign on a property when the contract is signed? Why is the listing removed from the MLS as active? The subsequent data on the sale closings, which the NAR calls “existing home sales,” is a meaningless formality. Almost all contracts close. The number of current contracts is the most timely indicator of current sales volume.
That said, the number of sales in January actually rose 21.7% from December. That could only be seen as a decline through the magic mushroom lense of seasonal adjustment. A 21.7% increase is consistent with the typical January. There are always more contracts signed in January than in December, so to see whether this January was strong or weak, we compare it with past years. January 2016 was only up 16.4%. The average change in January since the housing crash bottomed in 2010 was +20.6%. This year was perfectly consistent with an average January performance.
The sky isn’t falling yet. But the clouds are being seeded.
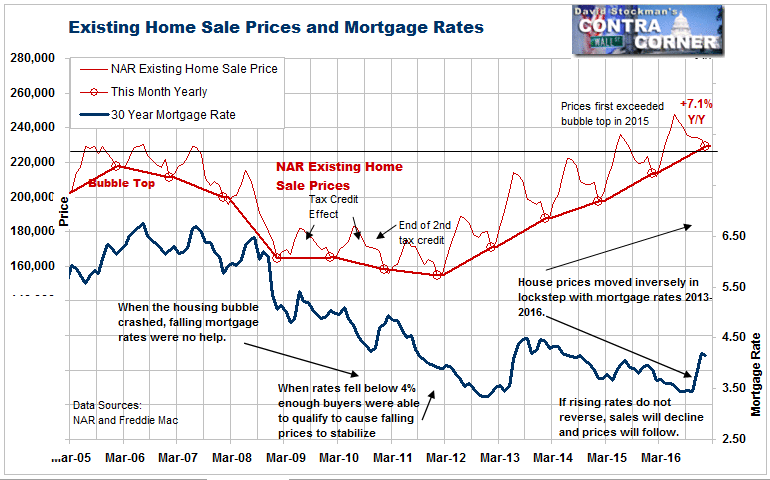
When we look at the big picture, the data becomes more troublesome. The year to year change was +2.7%. Again, that’s not a catastrophe, but in a world where mortgage rates surged from last summer until now, the slow growth is a warning of declines ahead if mortgage rates continue to rise.
This is something that the Fed knows, and will weigh heavily on how they posture on interest rates for the rest of this year. On the other hand, they are getting a clue that they’re behind the curve on inflation so that will push them to tighten. Things will get real when the Fedheads start discussing reducing their asset holdings.
Meanwhile, the bond market will respond to market forces. With the 10 year rangebound between 2.30-2.60, the ultimate move will depend on the direction of the breakout from that range. With mortgage rates closely tied to the 10 year Treasury, an upside yield breakout will trigger the endgame. Any talk of the Fed shedding assets should push yields higher.
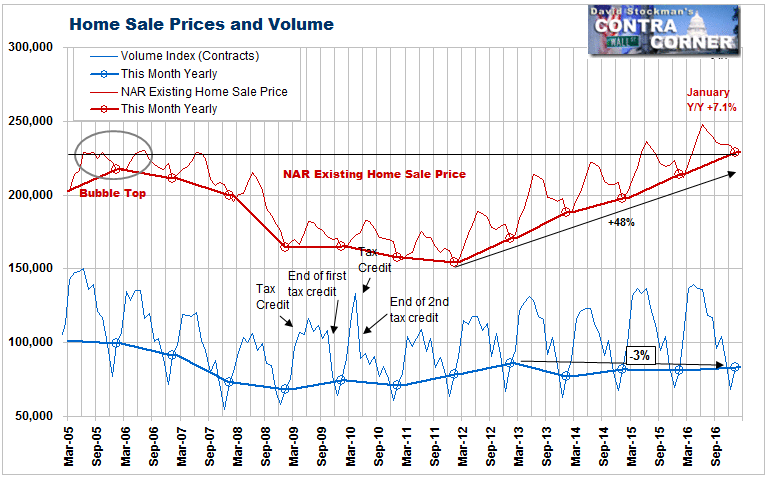
To illustrate how weak the home resale market is, the current sales rate is just 1% higher than 2 years ago. While the month to month performance is fairly typical, the market hasn’t grown in 2 years. In fact, the current sales rate is DOWN 3% from January 2013. The market has actually trending weaker for 4 years, in spite of population growth, and in spite of a supposedly growing economy spawning lots of new jobs.
At the same time, home price inflation is raging. The NAR reported last week that home prices reached a 7.1% annual inflation rate in January. Prices are well above the bubble highs at this time of year.
Price inflation on low sales volume is not a sign of strength. It can only be sustained by a continuation of the Fed subsidizing buyers via record low mortgage rates. The Fed continues to foster that by buying enough MBS in the market every month to keep its balance sheet from shrinking.
God help the housing market if the Fed ever decides to end those replacement purchases. There simply are not enough high paying jobs being created to drive an increase in prices or sales without constantly falling mortgage rates. Even stable rates could result in a slowly shrinking market.
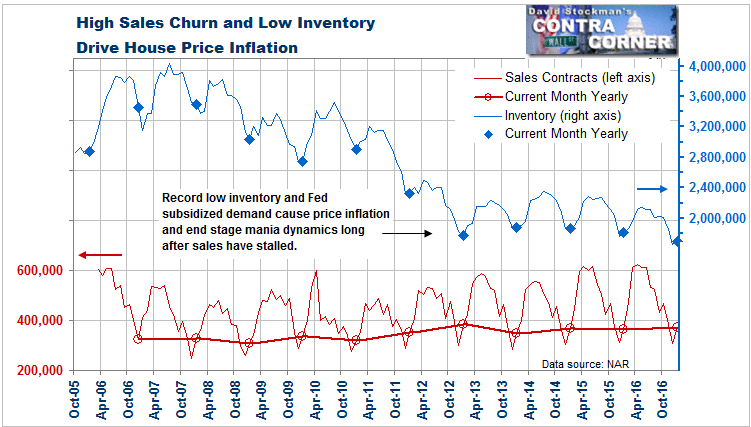
Meanwhile, supply is at a record low, again partly due to low rates. If you are an older empty nester why would you sell if you can’t get a decent return on cash, especially when the value of your house is still inflating?
But if sellers think that if they wait, they’ll get a higher price, they’re playing Russian Roulette with mortgage rates. If rates rise from here, sales will either stall or prices will fall, or both. That will leave would-be sellers in the lurch. At higher mortgage rates, the few sales that would occur at current price levels would prove illusory for most sellers, just as they did in 2006 and 2007. Prices stayed high for a while, but sales all but dried up.
We all know what came next. The Crash.
Follow Lee’s weekly market timing reports, including ETF trading recommendations, in the Wall Street Examiner Pro Trader Market Updates. Picks closed so far in February or currently still open have an average gain of 3.4% and an average holding period of 22 calendar days. Try the service risk free for 90 days and see if Lee’s methods can help you become a more successful investor.

