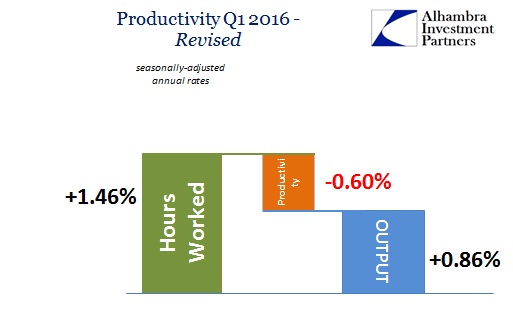
The BLS updated its productivity estimates yesterday to incorporate the BEA’s slight upward revision in GDP for Q1 2016. The changes to the productivity series were also small, where the initial estimate was for -1% (annualized) US labor productivity now revised to -0.6%. Private output, the BLS’s matching point in the BEA GDP series, was revised slightly higher to 0.86%.
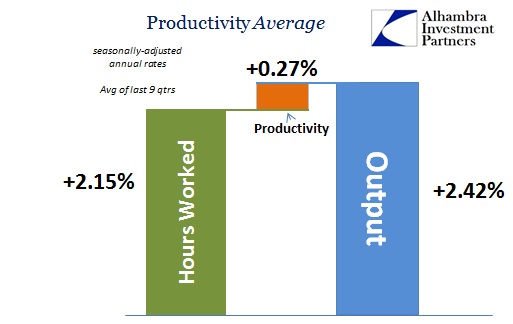
Since the start of 2014, total hours worked have averaged a gain of 2.15% (annualized) and thus the “best jobs market in decades.” That is significantly better than the 1.67% average increase in total hours during the worst of the housing bubble (2004-07) and more than double that “recovery” period as a whole (1.03% 2003-07). It is also more than the late 1990’s, where total hours averaged 1.96% from 1995 to 2000.
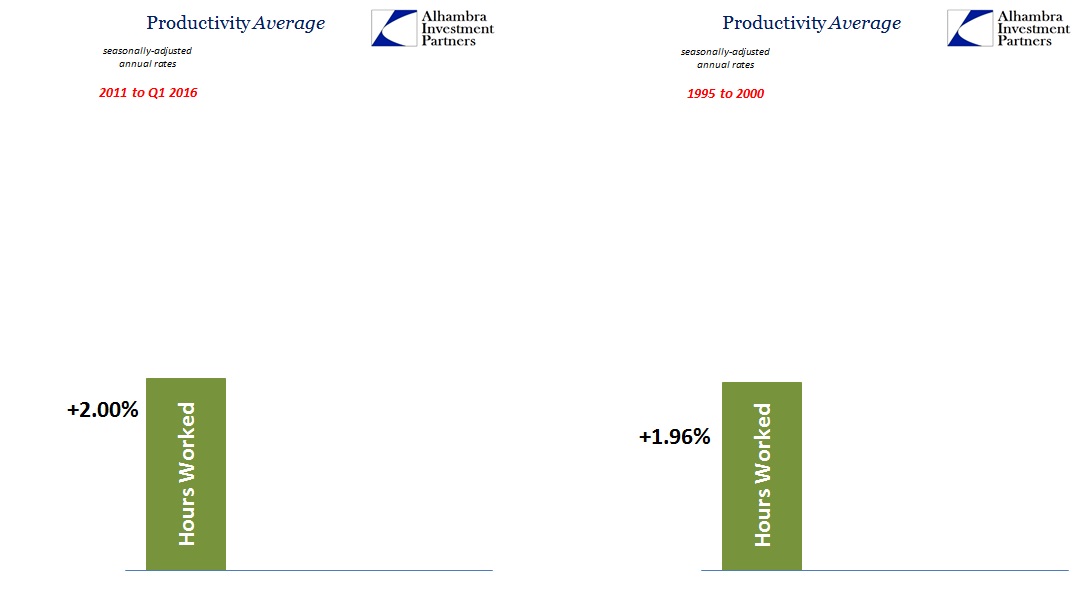
For the BLS, the recovery in total hours has been almost perfectly steady. Even though the period from the middle of 2014 until recently has been classified in historically glowing terms, from the perspective of just hours worked the years prior to it weren’t actually that much different. In fact, the average gain from 2011 through Q1 2016 is exactly 2%. That suggests the jobs market over the past five and one quarter years is just about the same for labor input growth as during the dot-com bubble.
Yet we know the economic circumstances were wholly different then. From the BEA’s side, private output has only been about half of what was gained, on average, during those last six years of the dot-com age. That can only mean one of three possibilities: 1. The BEA is severely understating output, which is highly unlikely not only given the lack of robust expansion in every other data series but also revisions of late due to the 2012 Economic Census removing a lot of cyclical bias; 2. Economic productivity has actually dropped to zero in the real economy (not just the statistic) for just more than a half a decade, which undermines the very foundation of economic growth in the first place; or 3. The BLS has vastly overstated the labor recovery in this assumed cycle.
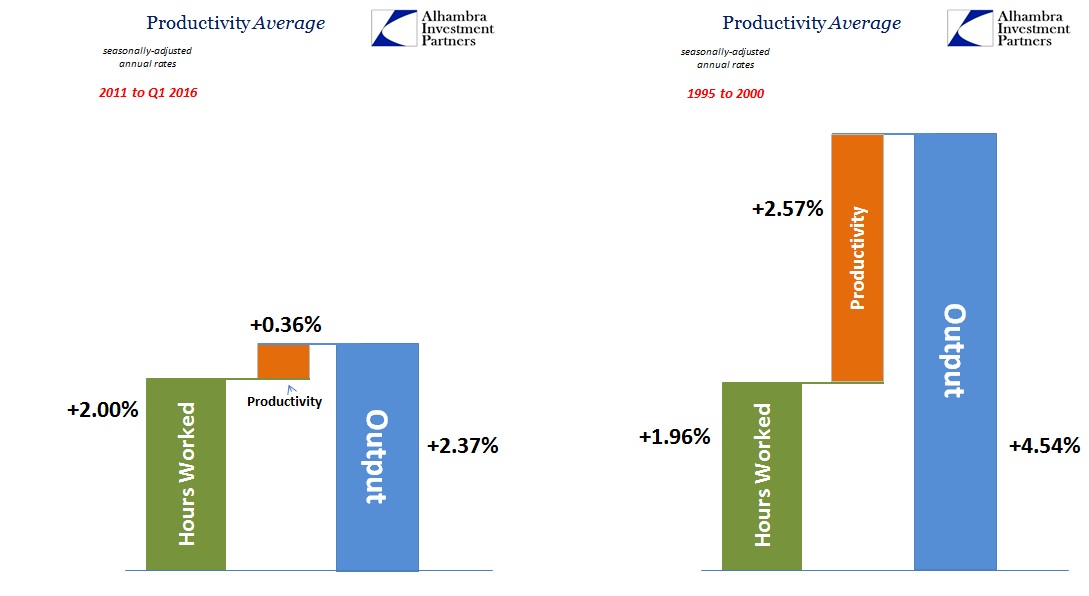
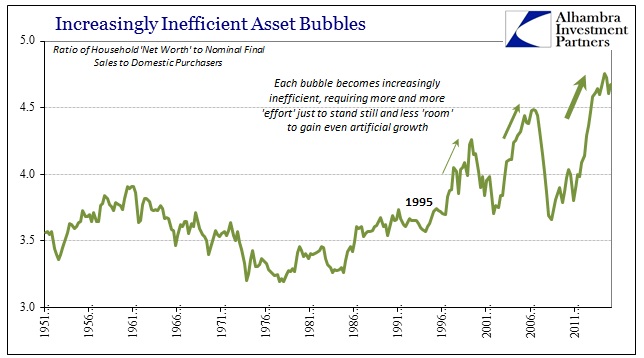
The right side on the graphic above is how the economy is supposed to look; sustained advance, even heavily artificial as in the latter 1990’s and the earlier eurodollar stage, is a balanced mix of labor utilization and capital efficiency. The left side is entirely abhorrent on every level, from common sense to statistical. These productivity estimates, driven really by the labor figures, force us to believe that the labor markets in both periods are the same even though the economic results could not be more different; therefore leading to the interpretation that the economy itself is entirely changed. It is a full contradiction since labor is the basis of any real economy and is thus inseparable from it; you cannot have the same kind of labor advance that leads to entirely different output levels.
At least that part is true in the capitalist sense of free market for labor. You might be able to replicate the results seen above in closely following John Maynard Keynes’ advice to build pyramids in the desert or to dig up and bury gold by turn (borrowing heavily from the work of fellow Englishman William Petty who centuries before suggested building a useless pyramid on Salisbury plains or packaging up Stonehenge and transporting it to London, all in the name of “stimulus” before the word ever attained an economic context). In other words, it cannot be anything but unnatural, inorganic implantation of government intervention (fiscal or monetary) that could so dismally reduce the productivity of labor in such a very short amount of time (two decades is not a long time when contemplating the increasingly thorough destruction of economic potential).
In the current age, there can be no doubt of monetary bifurcation where those in the “money” sector have done very well at the expense of those farthest from it (at the “bottom”). These results are somewhat muddied in the US but are seen very clearly in Japan from the influence of QQE. Japanese households have been devastated but Japan’s economy has suffered only continuous, slow recession rather than collapse. The export sector (in nominal yen terms) as well as the larger corporate participants have all done well by their own count without creating the expected virtuous further circulation through wages. They have no reason to do so other than government prodding and command; there isn’t anything more for Japanese labor to actually produce.
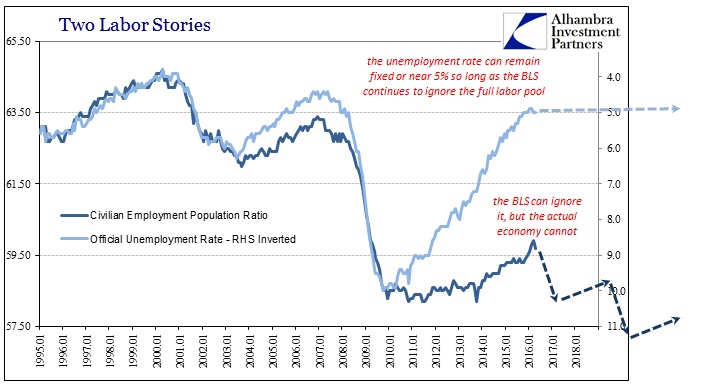
You can actually see the erosion in Japan’s economy through its broader labor market statistics. The mainstream focuses almost exclusively on the unemployment rate, but as inappropriate as that is here it is more so in Japan. Despite the fact that the unemployment rate, already low, got only lower, that obscures the real economic circumstance with regard to the most fundamental element of any economy. Total hours worked in manufacturing, according to Japan’s Ministry of Health, Labour and Welfare, was slightly less in 2015 than 2012. For all the gains in nominal export sales, it didn’t translate at all into even the slimmest gain in productive activity in the very sector that should have been, according to the idea of “stimulus”, booming all along. In wholesale and retail trade, total hours were 1.5% less in 2015 than 2012. And for the Japanese economy overall, there were an estimated 1.6% fewer total hours worked in 2015 than 2012.
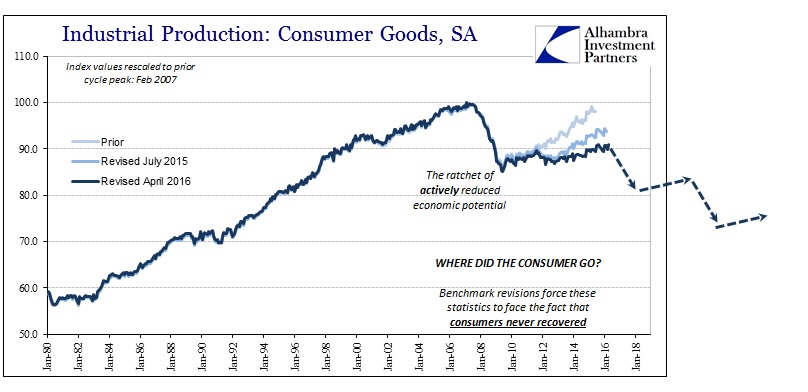
Though the sign is positive in front of US labor numbers, peak-to-peak, the situation is exactly the same. The BLS wants to suggest that the US economy is recovering at a normal to above normal pace without any account of the whole context.
Like the Japanese Ministry of Health, Labour and Welfare, the US Bureau of Labor Statistics keeps track of total hours worked in the US economy. The change in labor utilization in the aggregate, in direct contrast to what the unemployment rate suggests, is so severe and obvious that the data series could appropriately be retitled as the US Index of Screwing Over American Workers.
As of these latest revisions, the BLS estimates that total labor output in terms of total hours has increased by just 1.31% over the prior peak in the middle of 2007. Going back to the cyclical peak before that, in the middle of 2000, total hours worked in Q1 2016 was only 2.31% more despite the span of almost sixteen years.
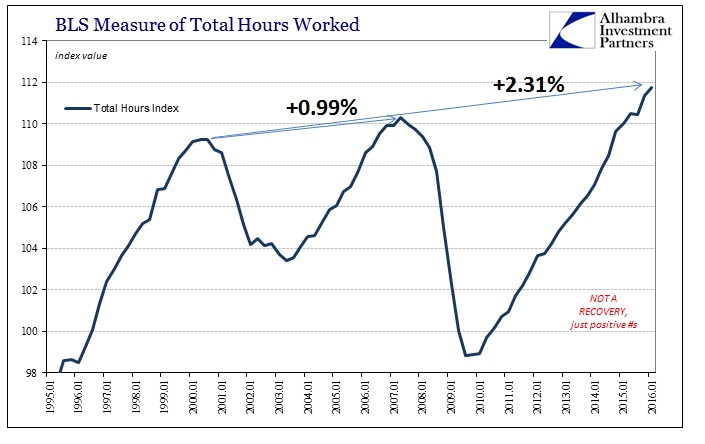
This is an unprecedented departure from every prior business cycle – and it has repeated for the second time, only with the latest featuring the largest contraction portion experienced since the Great Depression. The BLS gives us no reason as to why or how this could be, except to suggest by its labor growth figures that everything is normal and as good as the late 1990’s.
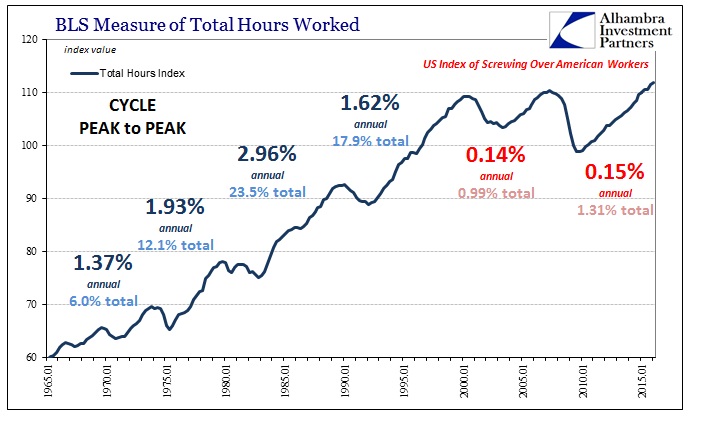
The comparison to all prior business cycles (I have omitted the first of the early 1980’s double dip recessions) is no comparison at all. Even during the worst of the Great Inflation, the expansion period after the 1974-75 recession, there was far more labor growth than anything seen in the 21st century. Inflation at that time may have been terribly disruptive in terms workers’ wages, but the overall economy was at least producing while that imbalance was wreaking havoc; we don’t even get production anymore, like Japan, though the mayhem is repeated.
It has been said that the 1970’s were worse because of stagflation, the combination of inflation and stagnation, but that supposes the stagnation of the current age is the same as then and thus “better” overall because this one is absent any similar spiral of consumer prices. This is demonstrably false as shown above; though we may not have double digit increases in the CPI, there is no comparison in terms of the stagnation. Again, the US economy not just in terms of labor but primarily with it is at a different, far more nefarious level of inertia and lethargy (such that it leads to all manner of “confused” statistical accounts).
To my analysis, this all suggests that the inefficiency of the US economy and labor utilization applies more to the longer-term disaster of this whole century that looks suspiciously like a depression, leaving the BLS to mistakenly enter recovery-like statistics where they are not appropriate (twice). In other words, the productivity mismatch points yet again to the statistical over-estimation of the labor “recovery” while the ongoing, 21st century slump explains how the economy could be so vastly different these past five years as compared to the late 1990’s (when asset bubbles at least had much more direct economic effect).
Unfortunately, this assertion supersedes whether productivity really is zero or anything in between because the true problem and its true scale are bigger than any cycle. In fact, it increasingly looks like there haven’t been any actual cycles at all in the 2000’s, just the expectations for them.