Recognizing the danger of relying too much on a PMI, the official version of the Chinese PMI not only disappointed absent any detectable rebound it also contained at least a superficial indication that the US isn’t experiencing one either. Overall, the PMI stayed right at 50, for whatever that might be worth, but several key subcomponents moved deeper below that level.
The PMI index for new orders – a proxy for foreign and domestic demand – was unchanged at 50.2 in April from March. New export orders contracted again and at a slightly faster pace, falling to 48.1 from 48.3 in March.
So it was bad news for China and a continued and related negative reflection on the gathering US “slump.” Since these are April figures, and new orders at that, they would be forward-looking and somewhat determined by US businesses and US “demand” as perceptions about the rest of the year start to coalesce. This dual nature is, of course, nothing new but after the drastic decline in import activity that even showed up in the Q1 GDP report “global growth” is seriously at risk.
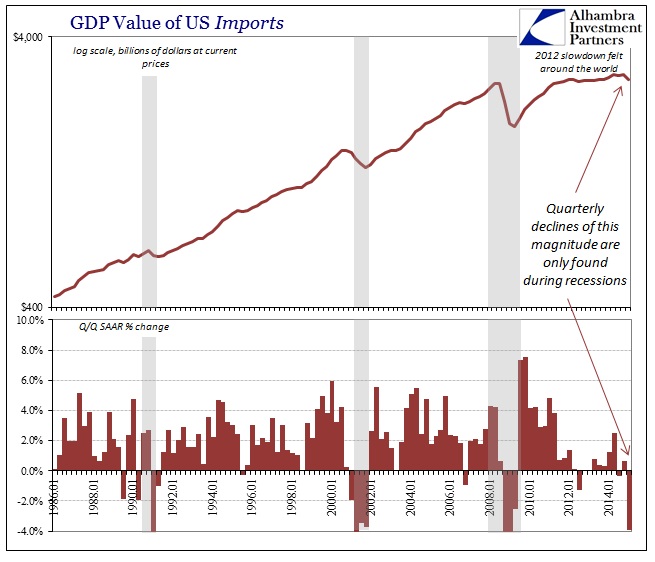
The only time you see declines of this magnitude are during recessions, a depressive state that China can further attest to. As is plain from the GDP figures shown above, this really isn’t anything new except the possibility of a deeper retraction of US “demand” from what already is clearly missing. Chinese economic figures seem to be at least coincident with US reductions in activity, if not a leading indication of it. We will get more and national-specific estimates later this month from the Census Bureau, but from all this we can reasonably expect nothing much positive from the Chinese portion (except that, in terms of GDP, lower imports are actually accretive).
Like the confusing nature of “inflation” and consumer spending, Q1 GDP was only aided by a small amount owing to a seriously negative import deflator. Where nominal imports fell by 4%, the import deflator was -4.4%. Again, rather than indicating a more positive position of the US buying more and paying less for it, given the detractions clearly showing up almost everywhere it is far more likely that the deflator is over-playing the oil price decline.
In fact, the deflators across the GDP subcomponents show historically low levels that are never associated with “good deflation.” The overall GDP deflator itself was negative for only the third time in a half century, with the other two being during the Great Recession itself (this was actually true of Q4 2014 at one point, but revisions have turned that very slightly positive).
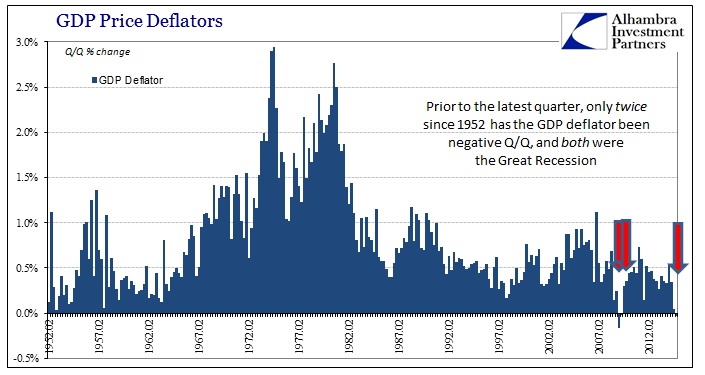
There are thus two consecutive quarters with if not both negative then some of the lowest deflator readings in succession in the entire data series. The same goes whether you calculate “inflation” year-over-year and even for the very important (to monetary policy authorities) PCE deflator.
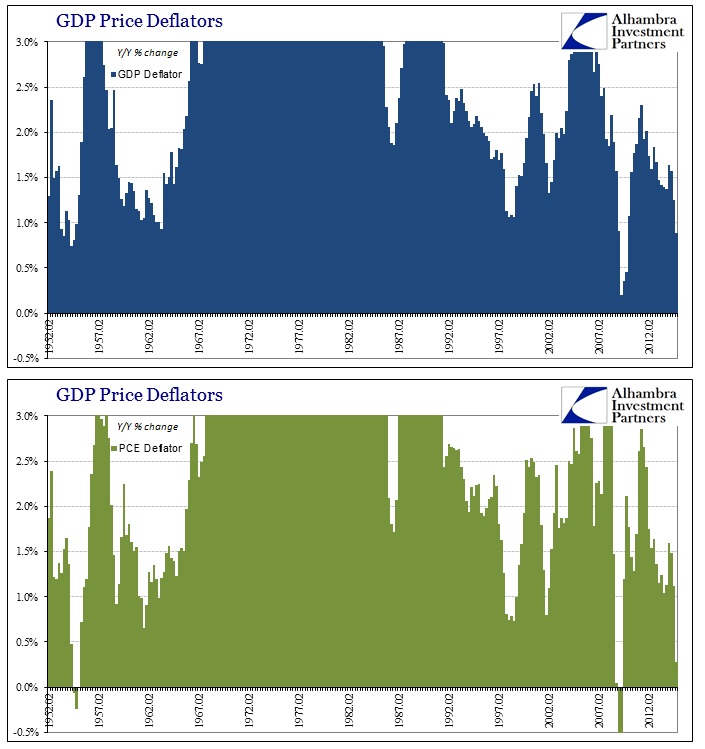
The PCE deflator, for example, Y/Y in Q1 2015 was quite a bit less than Q4 2008 and not much different than what we saw in Q1 2009. By all these various accounts, especially from the orthodox perspective which views inflation and demand almost interchangeably, there is something very wrong with the US economy; far and above even last year’s “aberration.”
For so much attention to demand, from every government source, there is such a shocking lack of it up and down the US system. In that respect, GDP does no favors in that it was made to make the economy look its absolute best. The last few years certainly fall under that category, especially after the massive revisions to GDP that were produced in July 2014 that made it seem like the economy was gaining strength. Stripped of some of its more artificial and inefficient channels, however, it was more obvious the Chinese version of the US economy.
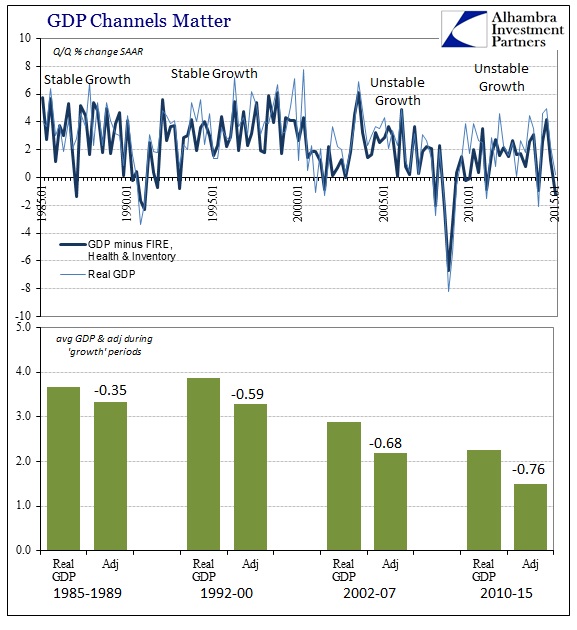
For a recovery, it is absolutely amazing that GDP growth without the highly inefficient (from a true economic perspective) financial and health sectors, as well as inventory, has averaged an astonishingly low 1.49% (2010-2015). In other words, again, there is a shocking lack of relevant demand coming from the US economy and it has taken a nasty turn into the start of 2015. Q1 GDP without those sectors was -1.25%, the worst quarter since Q1 2009.
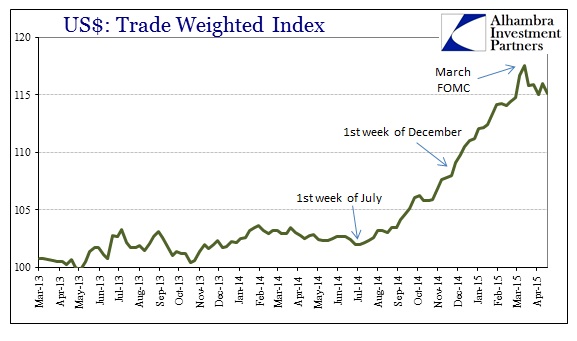
It all adds further appreciation as to why the PBOC and Chinese authorities are ignoring whatever the FOMC says about the US economy and are preparing for economic life in China without it – bubbles, dollar and all. But the worst interpretation about the PMI is that as bad as Q1 was, and it was recession bad, there may not even be any increase from that low level in April already! The decline itself is bad, but if economic activity remains that bad then the problems only grow exponentially. The more this “slump” accumulates the more it will gather in greater downstream adjustments and ultimately cuts and setbacks. Obviously, we are not talking weather here if that is the case (as if it ever was, even for Q1 2014), just as the “dollar” has been transmitting well ahead of the economic curve.