
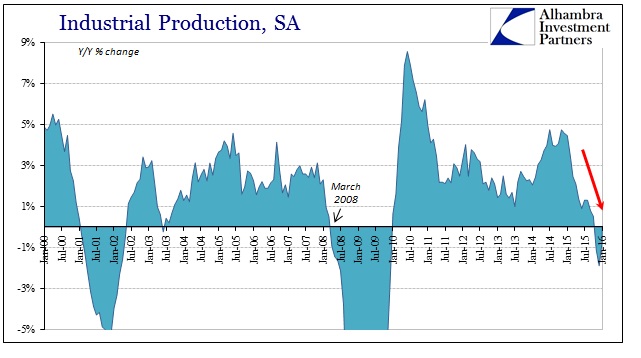
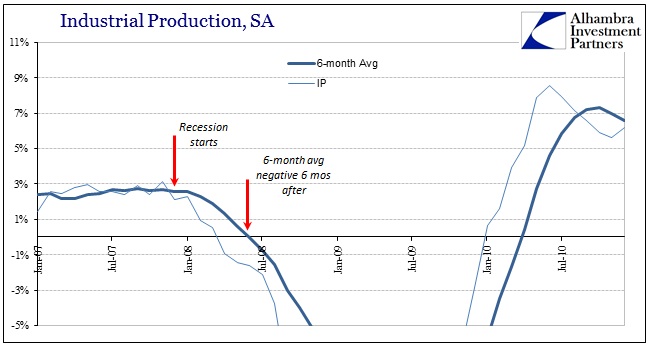
Industrial production fell 0.7% in January 2016 which was slightly better than the (revised) -1.9% estimated for December. It was, however, the third consecutive month showing a decline and, more importantly, the 6-month average turned negative for the first time in the “cycle.” Industrial production, at least as far as the Federal Reserve’s estimated series for it, is actually a lagging indication particularly in the average. In other words, in every other cycle by the time the 6-month average falls below zero the recession is already several months old.
The consistency with which we find that to be the case is very significant. In every recession since World War II, we find contracting IP shortly after each official cycle peak (declared by the NBER). The one exception is the 1990-91 recession where industrial production briefly dropped to slightly negative several months prior to the start of that recession, only to rebound somewhat into its early stages and before again falling further below zero in accordance with this overall long-term pattern.
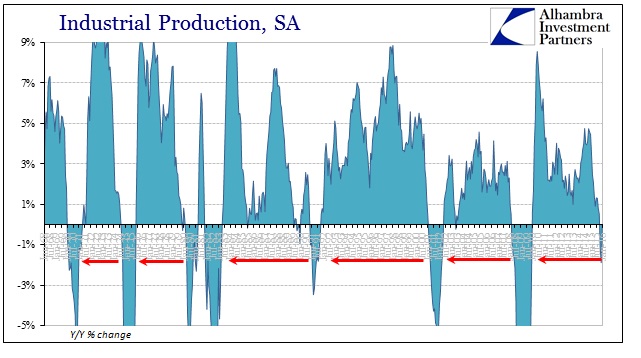
What that repeated pattern suggests is the slowing across industry (second derivative) is the relevant part of the initial recession impulse and not necessarily the actual contraction; that part becomes relevant later toward the trough in determining its severity, or reacting to it in other fashions. Again, this has been remarkably consistent in each post-war recession including the last two officially declared in this century. That would strongly suggest recessionary factors build elsewhere before impacting into contraction in this broad classification for US industry. From that view, we can surmise that when the 6-month average for IP does turn negative it does so as the US economy has already undergone strong recessionary pressure and taken already significant dislocation.
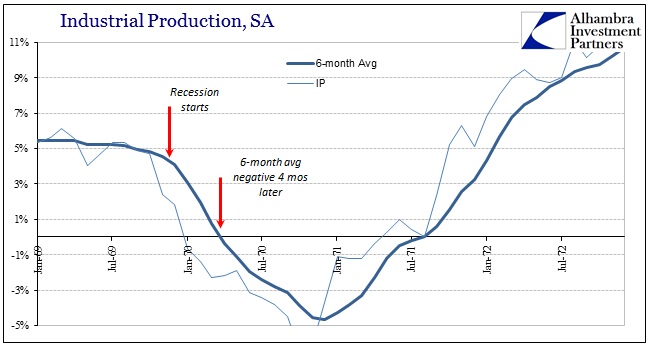
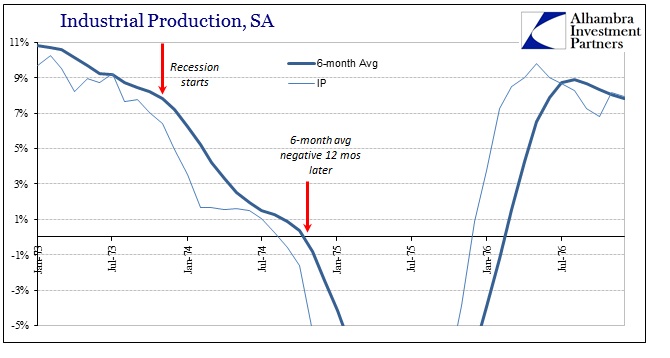
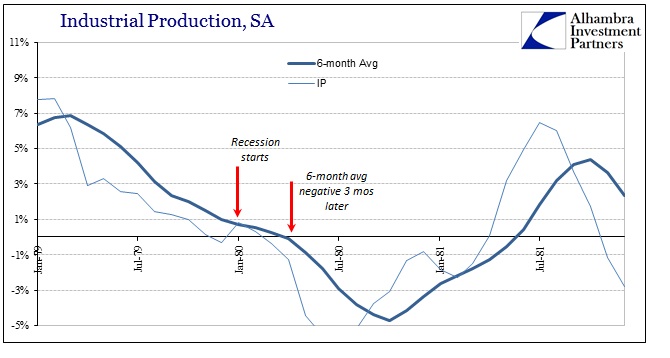

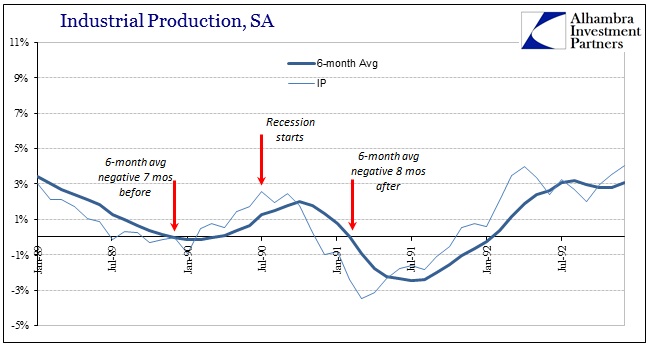
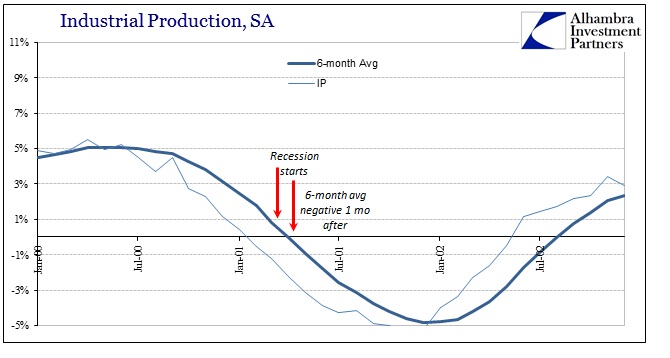
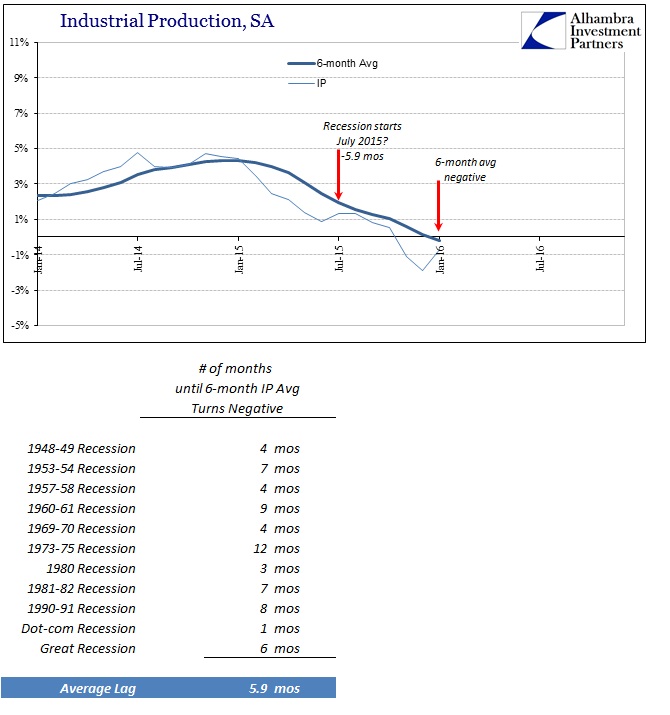
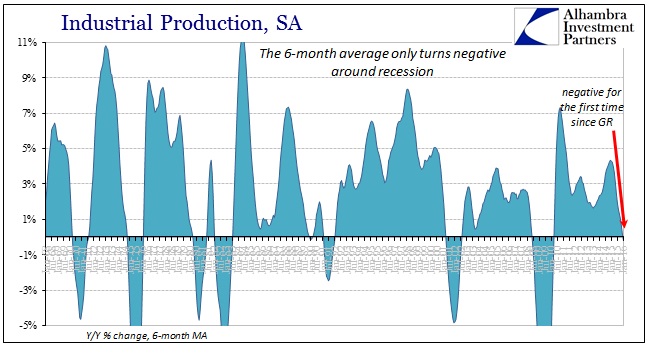
I have shown above only the seven recession events since 1969-70, but I calculated the average lag using all of the post-war contractions. The average time between official recession start and a negative read for the IP 6-month average is just less than 6 months. Again, the uniformity and consistency is what is significant, even taking into account the prior anomaly in 1990. Using this one data point it would suggest that a recession may have begun sometime around July 2015 – which would be perfectly consistent with a whole host of other economic accounts (though, conspicuously not employment estimates), if not certainly market-driven turmoil in across a great many markets (now including stocks).
To be clear, this is not to say with a full degree of confidence that a full-scale recession began last summer, only that the Industrial Production estimates (which are subject to often serious revisions in either direction) offer more and compelling evidence (given the uniform correlation through its history) that the US economy is at the very least in serious and widespread trouble. There are mitigating factors to consider as well as the fact that the current period is in many ways unlike anything we have ever seen, perhaps rendering any correlation dangerous.
Even given those caveats, that such a robust indication is perfectly in line with so many other accounts of the economy, US and global, would tend to suggest a more conforming interpretation. On just a general observational level, there was a great deal that shifted around the middle of last year that would justify an elevated depression upon instinct and function in the real economy – including and especially the “dollar.”
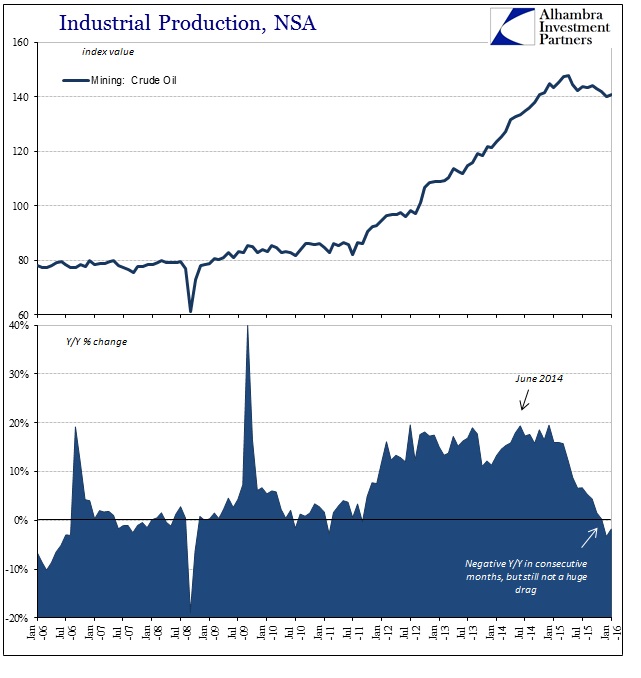
Furthermore, the contraction in IP is still yet to see any significant pull from the reduction in oil activity and production. The subindex for mining/oil has only been negative the past two months (November was revised upward to a positive year-over-year comparison) with January’s contraction significantly less than December’s. That means overall weakness in industrial production is not in any way concentrated in energy as the mainstream seems to wish it.
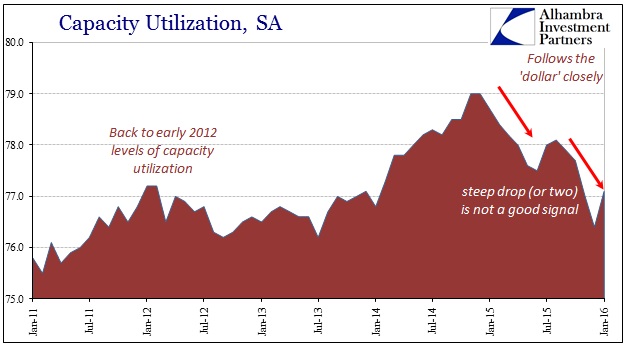
Capacity utilization was similarly calculated better in January though at this point there is no reason to suspect anything other than monthly variation. The utilization rate similarly increased in July and August last year before shutting back down into the second half of the year coincident to the heaviest slowing and contraction in IP overall.
Whether or not this leads the NBER to consider a recession dating is beside the point right now; what is relevant is what IP renders in especially the wider historical context about past recession and how that relates to our current circumstances. It suggests, with very little room for argument, that the US economy is already in truly dire condition and increasingly so at the same time as market indications suggest and price the very same. Unlike the unemployment rate, there is a great deal of consistency, internally and externally, that more and more precludes any basis for dismissing these suggestions no matter what the BLS’s models come up with.

