
“
Warning Signs Of A Recession
In late 2007, I was giving a presentation to a group of about 300 investors discussing the warning signs of an impending recessionary period in the economy. At that time, of course, it was near “blasphemy” to speak of such ills as there was “no recession in sight.”
Then, in December of that year, I penned that we were either in, or about to be in, the worst recession since the “Great Depression.” That warning too was ignored as then Fed Chairman Ben Bernanke stated that it was a “Goldilocks Economy.” The rest, as they say, is history.
I was reminded of this as I was reading an article by Myles Udland, via Business Insider, entitled “The US economy is nowhere near a recession.”
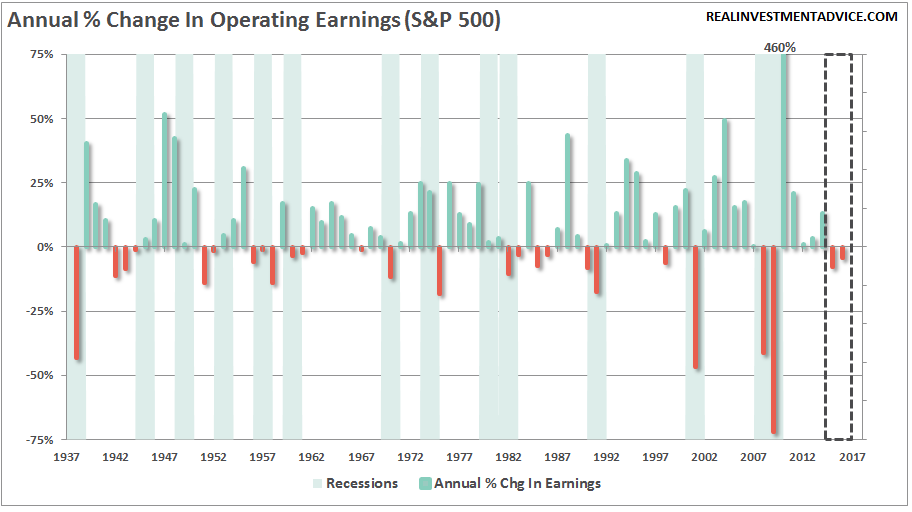
It is an interesting thought. However, the problem for most analysts/economists is that they tend to view economic data as a stagnant data point without respect for either the trend of the data or for the possibility of future negative revisions. As shown in the chart below, this is why it SEEMS the financial markets lead economic recessions.
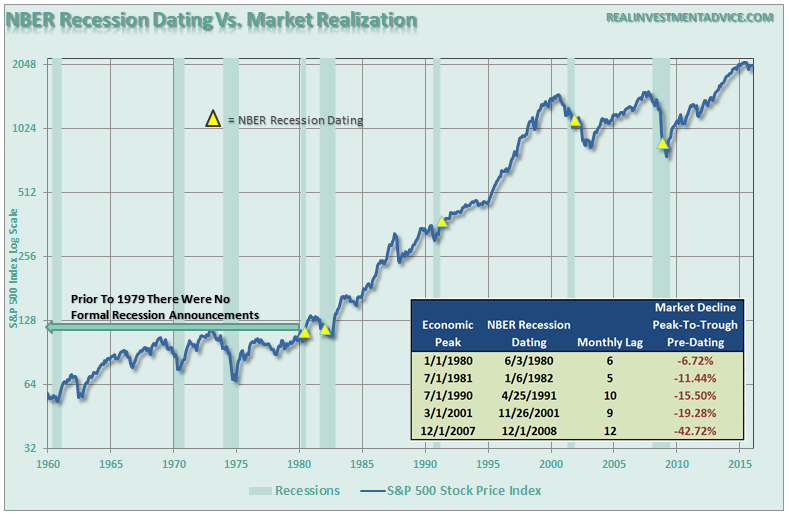
However, in reality, they are more coincident in nature. It is just that it takes roughly 6-12 months before the economic data is negatively revised to show the start of the recession. For example, the recession that started in 2007 was not known until a year later when the data had been revised enough to allow the NBER to make its official call.
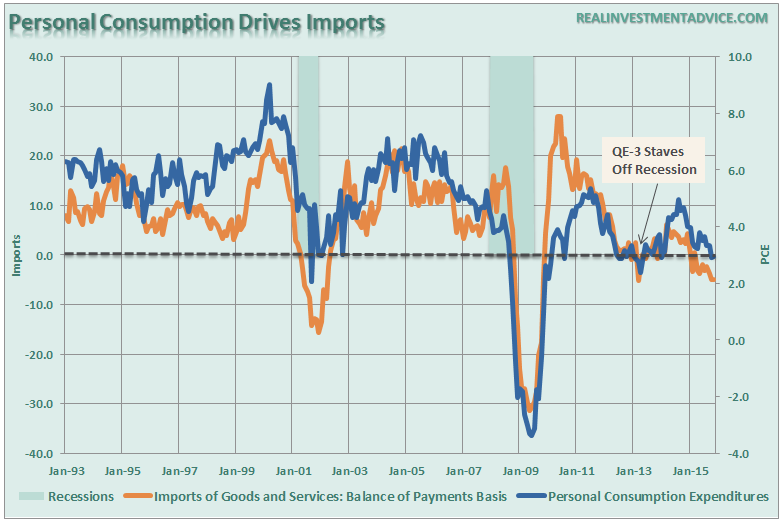
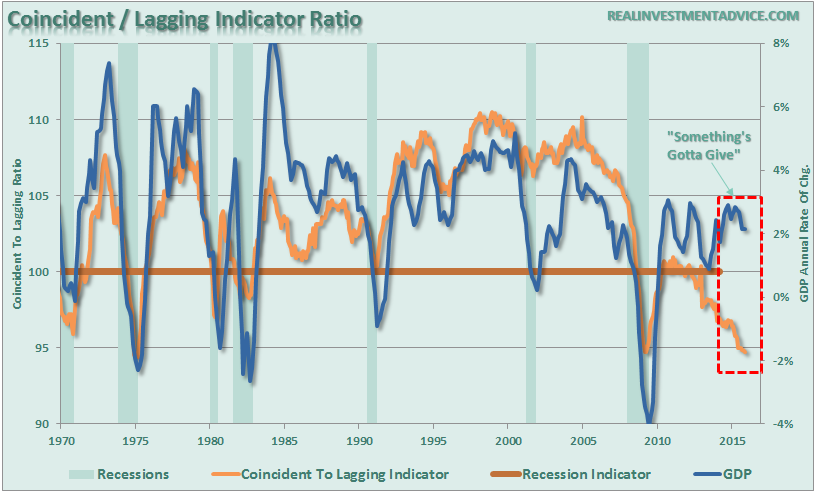
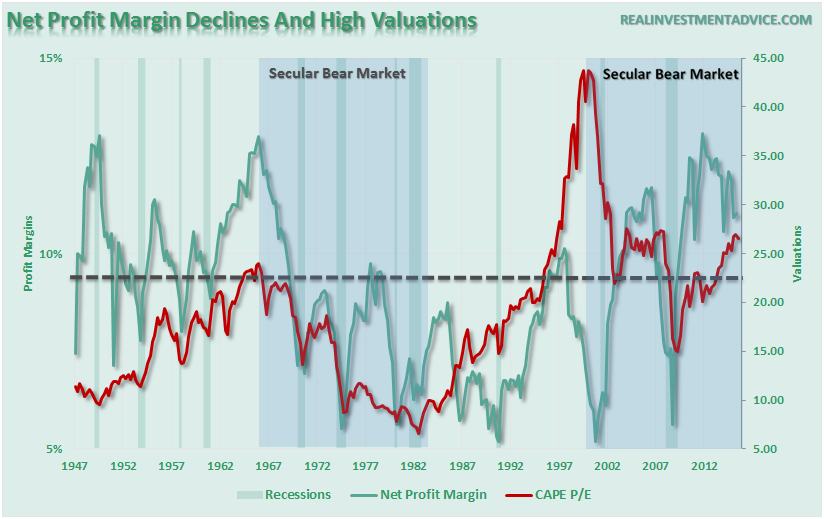
The market decline beginning this year is likely an early warning of further economic weakness ahead. I have warned for some time now that the economic cycle was exceedingly long given the underlying weakness of the growth and that eventually, without support from monetary policy, would likely give way. The following charts are the same ones I viewed in 2007, updated through the most recent data periods, which suggested the economy was approaching a recessionary state. While not all are in negative territory yet, they are all headed in that direction.
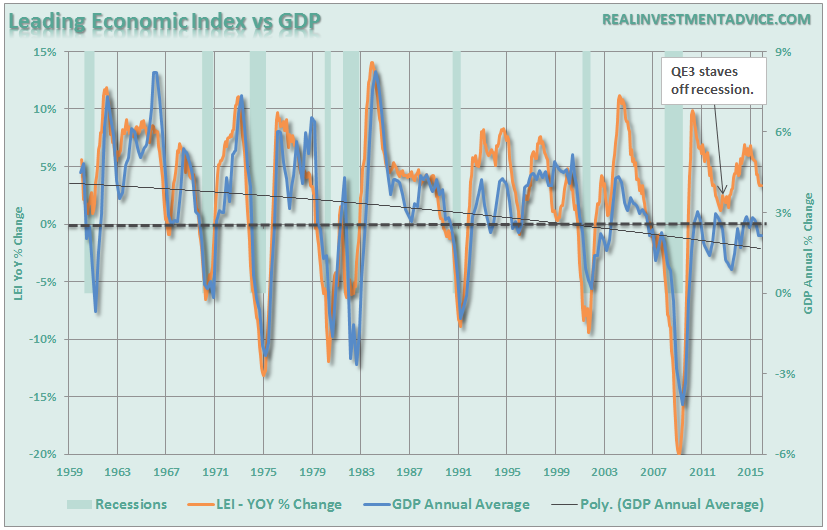
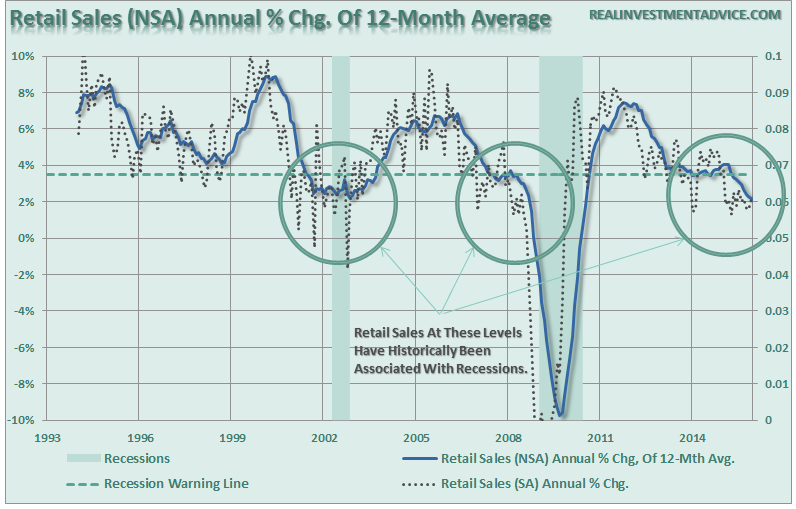
Is the economy “nowhere near recession?” Maybe. Maybe not. But the charts above look extremely similar to where we were at this point in late 2007 and early 2008.
Could this time be “different?” Sure. But historically speaking, it never has been.
The Topping Process Completes
For the last several months I have repeatedly discussed the topping process in the markets and warned against dismissing the current market action lightly. To wit:
“Typically bubbles have an asymmetric shape. The boom is long and slow to start. It accelerates gradually until it flattens out again during the twilight period. The bust is short and steep because it involves the forced liquidation of unsound positions.
The chart below is an example of asymmetric bubbles.
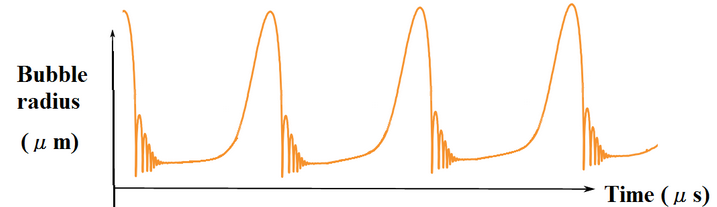
The pattern of bubbles is interesting because it changes the argument from a fundamental view to a technical view. Prices reflect the psychology of the market which can create a feedback loop between the markets and fundamentals.
This pattern of bubbles can be clearly seen at every bull market peak in history.”
Take a look at the graphic above, and the one below. See any similarities?
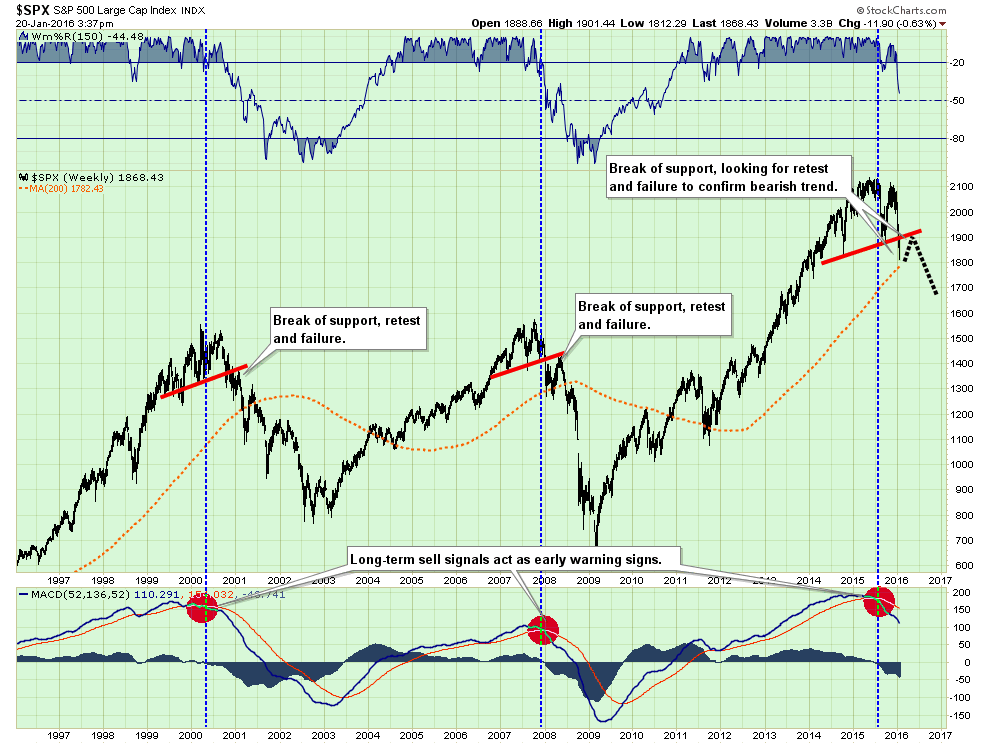
As you will notice, the previous two bull-market cycles ended when the topping process ended by breaking the rising support levels (red line). The confirmation of the onset of the “bear market” was marked by a failed rally back to the previous rising support level. Currently, that has not occurred as of yet.
The next chart is another variation of the above showing the break-down of the rising bullish trend in the market. In all cases, investors were given minor opportunities to reduce equity risk in portfolios well before the onset of the bear market decline.
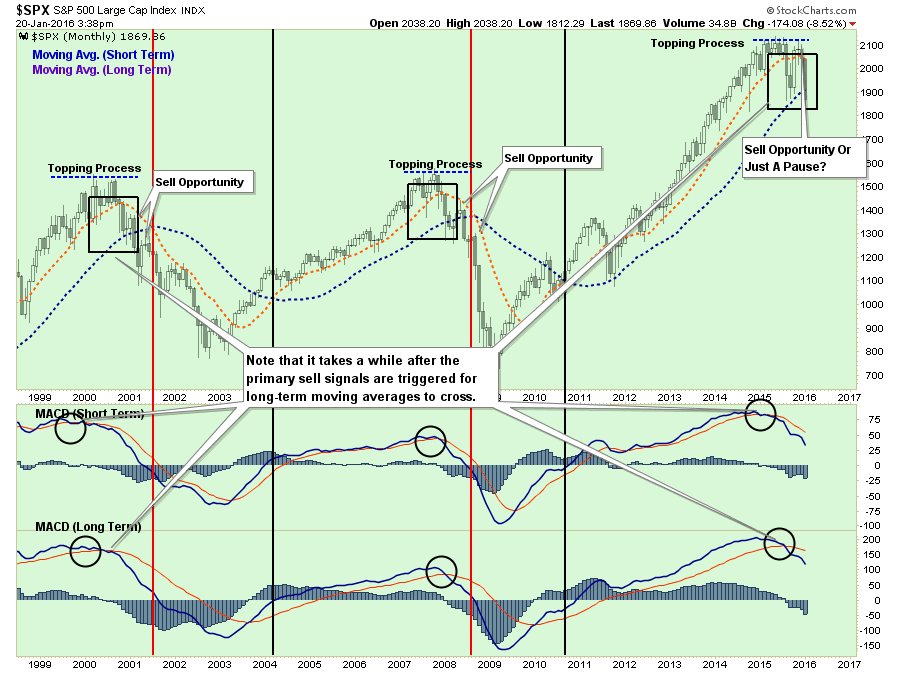
I have been asked repeatedly as of late whether or not the markets will provide a similar “relief rally” to allow for escape. The answer is “yes.” However, as in the past, those relief rallies tend to be short-lived and don’t get investors “back to where they were previously.”
The risk to the downside has risen markedly in recent weeks as the technical, fundamental and economic deterioration escalates. This is not a time to be complacent with your investments.
“One & Done Yellen” And The Rise Of QE4.
Back in December, when Janet Yellen announced the first hike in the Fed Funds rate in eleven years from .25% to .50%, the general mainstream consensus was “not to worry.” It was believed that a rate hike by the Fed would have little impact on equities given the strong economic recovery at hand. Well, that was what was believed anyway as even Ms. Yellen herself suggested the “odds were good” the economy would have ended up overshooting the Fed’s employment, growth and inflation goals had rates remained at low levels.
The problem for Ms. Yellen appears to have a been a gross misreading of the economic “tea leaves.” With economic growth weak, the tightening of monetary policy had a more negative impact on the markets and economy than most expected. As I wrote previously:
“Looking back through history, the evidence is quite compelling that from the time the first rate hike is induced into the system, it has started the countdown to the next recession. However, the timing between the first rate hike and the next recession is dependent on the level of economic growth at that time.
When looking at historical time frames, one must not look at averages of all rate hikes but rather what happened when a rate hiking campaign began from similar economic growth levels. Looking back in history we can only identify TWO previous times when the Fed began tightening monetary policy when economic growth rates were at 2% or less.
(There is a vast difference in timing for the economy to slide into recession from 6%, 4%, and 2% annual growth rates.)”
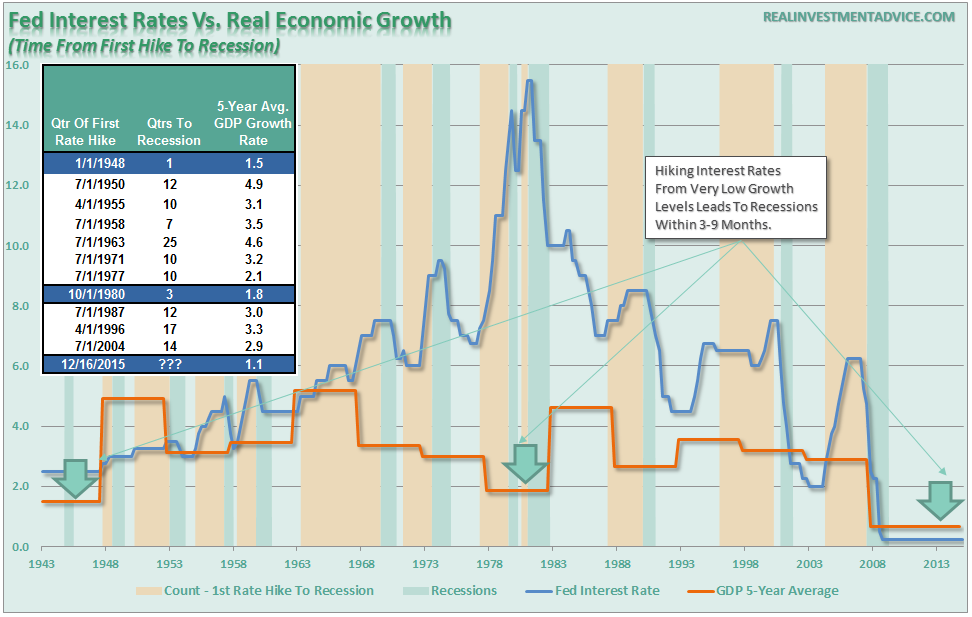
“With economic growth currently running at THE LOWEST average growth rate in American history, the time frame between the first rate and next recession will not be long.”
Given the reality that increases in interest rates is a monetary policy action that by its nature slows economic growth and quells inflation by raising borrowing costs, the only real issue is the timing.
With the markets appearing to have entered into a more severe correction mode, there is little ability for Ms. Yellen to raise interest rates any further. In fact, I would venture to guess that the rate hike in December was likely the only one we will see this year. Secondly, we are likely closer to the Federal Reserve beginning to drop “hints” about further accommodative actions (QE) if conditions continue to deteriorate.
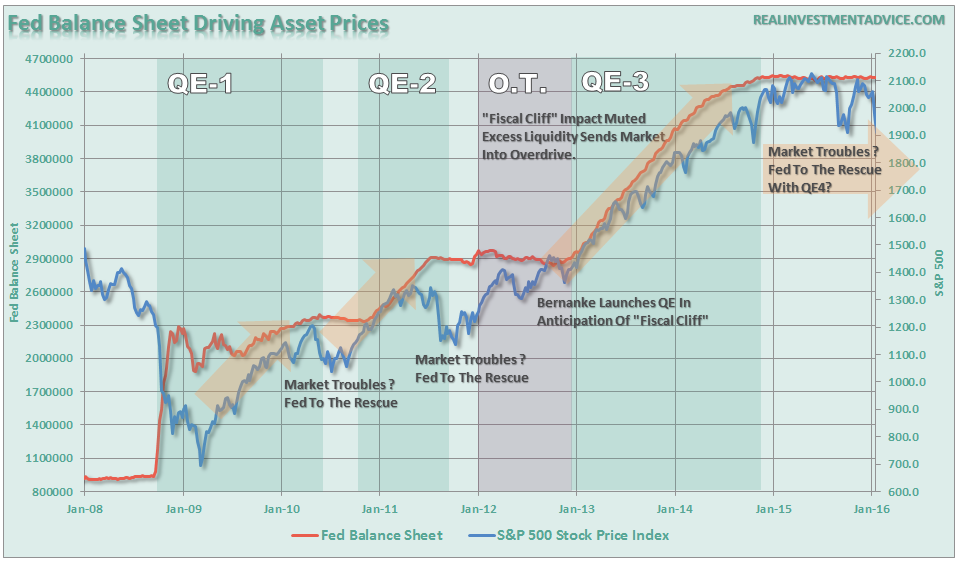
It is important to remember that in 2010, when Ben Bernanke launched the second round of QE, the Fed added a third mandate of boosting asset prices to their roster of full employment and price stability. The reasoning was simple – create an artificial wealth effect encouraging consumer confidence and boosting consumption. It worked to some degree by pulling forward future consumption but failed to spark self-sustaining organic economic growth.
With market pricing deteriorating sharply since the beginning of the year, it will not take long for consumer confidence to slip putting further downward pressure on already weak economic growth. With Ms. Yellen already well aware she is caught in a “liquidity trap,” there would be little surprise, just as we saw in 2010, 2011 and 2013, for the Fed to implement another QE program in hopes of keeping consumer confidence alive.
The issue is at some point, just as China is discovering now with failure of their monetary policy tools to stem the bursting of their financial bubble, the same will happen in the U.S. With the Fed unable to raise rates to reload that particular policy tool, a failure of QE to stabilize the markets could be deeply problematic.
Just some things to think about.
Lance Roberts

Lance Roberts is a Chief Portfolio Strategist/Economist for Clarity Financial. He is also the host of “The Lance Roberts Show” and Chief Editor of the “Real Investment Advice” website and author of “Real Investment Daily” blog and “Real Investment Report“. Follow Lance on Facebook, Twitter, and Linked-In

