The problem with using GDP as the primary means of economic accounting is its very nature. By attempting both comprehensiveness and precision, the resulting calculation is an agglomeration of various methods and sources, many of which are quite dynamic apart from static regressions. By that construction alone, GDP is susceptible to high degrees of kurtosis where assumptions find little. In other words, GDP is only as good as its correlations with other factors outside its statistical domain as a means of checking against all the assumptions and imputations that populate its subroutines.
We should expect, if GDP is constituent in its incorporation, to find close correlations with other data series. Since the consumer is thought the bedrock of this version of the economy (ignoring the myth of 70% consumerism), even still after the Great Recession, you would expect to find a solid relationship between GDP and something like retail sales (including how a version of retail sales feeds directly into GDP). And there is one; or, more specifically, was one.
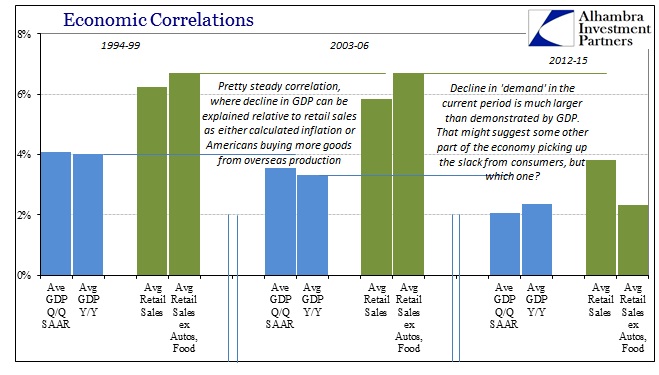
In the latter half (plus) of the 1990’s, GDP averaged 4.07% as measured by quarter-over-quarter changes in the seasonally-adjusted series. Measuring year-over-year produced almost an identical growth rate, 4.03%. Retail sales growth during that period was, as expected, robust, averaging 6.23% year-over-year in the full retail sales account, and even better, 6.71%, ex food and autos. After the dot-com recession and sluggish recovery, GDP returned to nearly the same level, averaging 3.54% Q/Q SAAR and 3.30% Y/Y until the housing bust. Retail sales were about the same (or slightly better in the case of ex autos), whereby we can explain the reduction in GDP as either calculated “inflation” or even the sharp tendency in the middle 2000’s to buy more goods from overseas sources (which would reduce GDP but not necessarily retail sales).
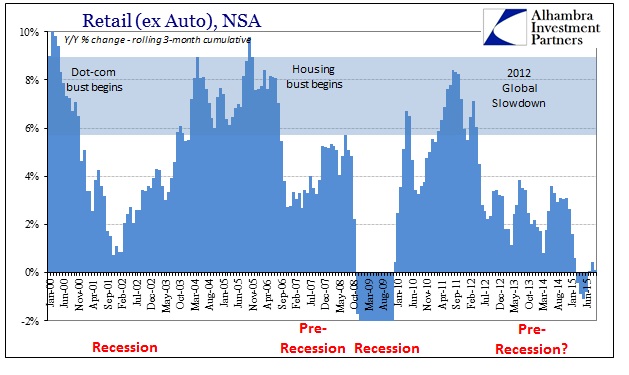
Of late, however, the correlation has broken down. GDP has averaged just 2% since 2012, incorporating the full weight of recent revisions about the 2012 slowdown that GDP didn’t even catch (retail sales did). However, even though GDP has been depressed, retail sales have been more so. Averaging 5.82% in the middle 2000’s, retail sales have averaged 2% less in the past nearly three years; ex autos the decline is enormous, from 6.71% to just 2.33%. That would indicate a large proportional increase in autos as an economic catalyst, though one born of simply credit rather than wages (which is completely corroborated by that difference).
The real problem now is that this de-correlation has only grown. The BLS, as well as the BEA, suggest the economy has picked up since the Polar Vortex fiasco of early 2014, as both the Establishment Survey and GDP have impressively gained since then. The GDP average, over the past five quarters, has jumped from just 1.71% from 2012 through Q1 2014 to 2.99% (though, it should be pointed out that Y/Y GDP has increased by much less; suggesting more about the SAAR than perhaps real economic gains and perhaps the wrong direction of “residual seasonality”). In that view, GDP suggests the economy is just short of its mid-2000’s form, but retail sales are nowhere near that level – and moving still and sharply opposite.
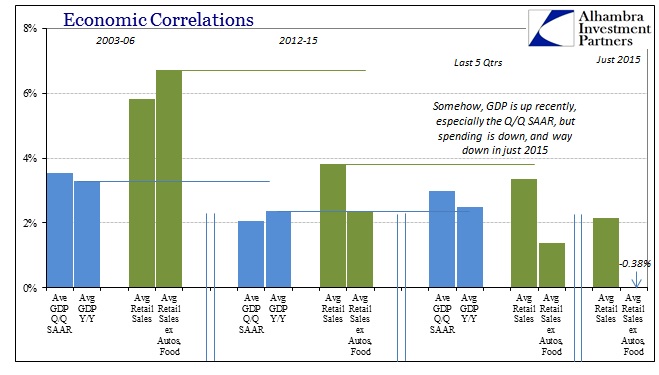
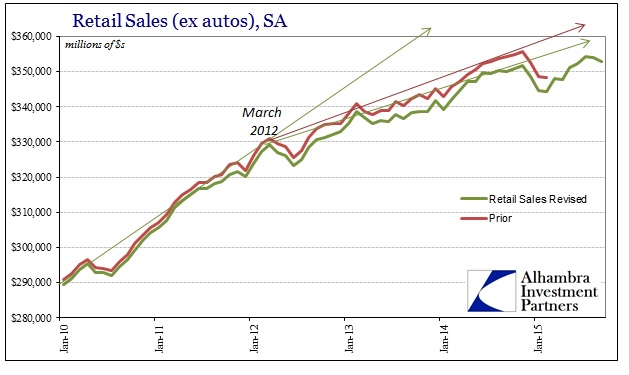
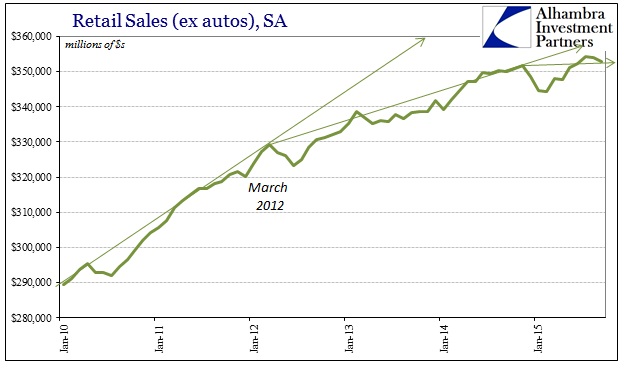
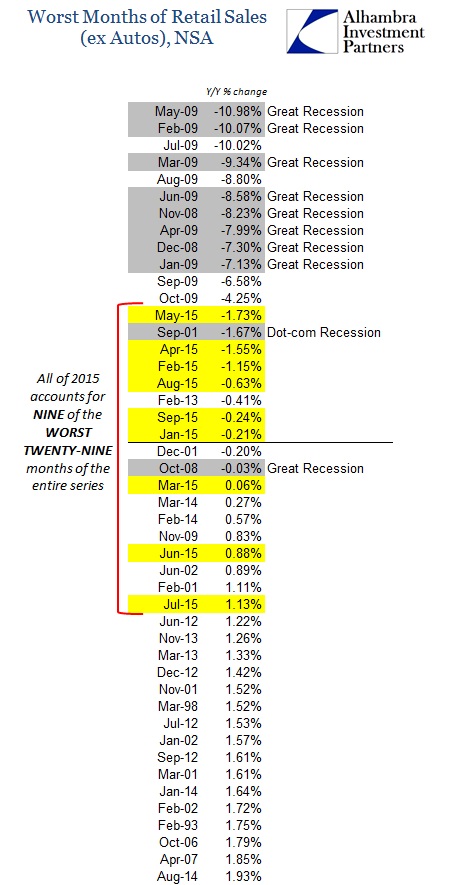
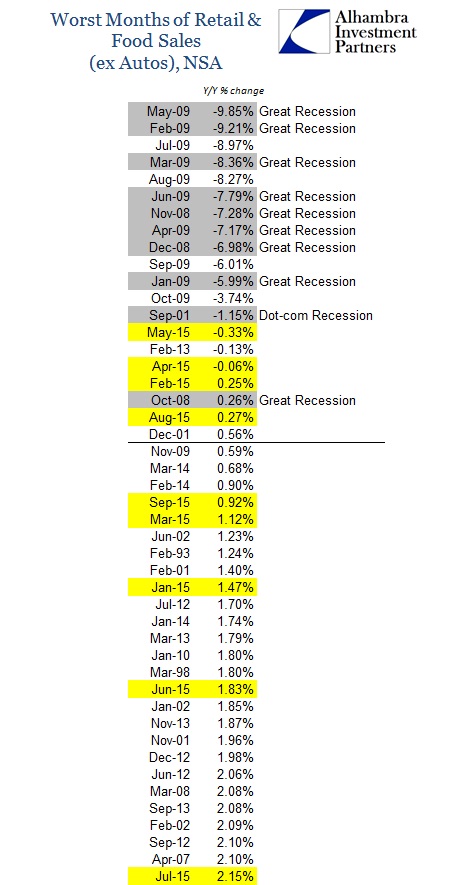
Even with autos, retail sales (including the latest figures for September) have averaged just 2.17% in 2015; ex autos and food they have contracted by an average of -0.38%. Has there been that much more domestic production to replace a sudden disdain for imports(all the while consumers are cutting back)? Are businesses in 2014 and 2015 (especially this year) taking the rising dollar that is depressing earnings and income to increase capex? Is the government finally ending “austerity”, as has been accused by the monetarists, having inaugurated a huge surge that somehow has made no dent in declining consumer spending?
I believe that is why GDP has attained a much more unstable and erratic nature, and one prone toward large and significant downward benchmark revisions. The form of GDP as it exists now is one that is highly subjective; a fact that we know in quantified terms from the BEA itself.
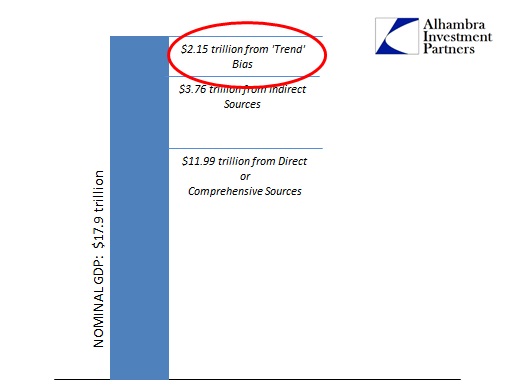
The BEA tells us that the economy surged in Q2, with the SAAR number revised all the way to 3.9%. Yet, for that account, retail sales (with autos) averaged a recessionary 1.8% in those three months; ex autos and food an alarming -1.1%! Even by GDP’s third revision, which the BEA calls the “Final” estimate, 12% is derived solely from its view of “trend”, which is, like the BLS’s Establishment Survey, no longer correlated with a broad range of economic estimates.
Until recently, that had been explained as a matter of services spending which instead only interjects more subjectivity given the huge imputations and adjustments that pass for such “spending” (including the largest of them all, owner’s equivalent rent). Even if we were to accept this disparity as consumers spending on services, it would still reflect horribly in terms of future expectations since any services spending is clearly coming at the direct expense of spending on goods. At best, then, that would suggest a strained consumer not at all bolstered by wages but auto loans; at worse, it relates an exhausted consumer that the major economic accounts are offsetting with phantom projections. Neither is consistent with “transitory.”
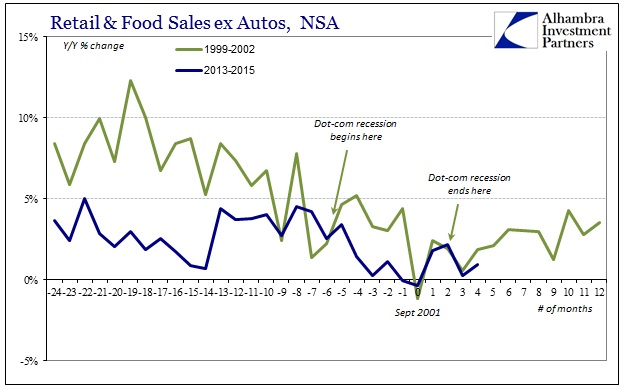
As to the latest retail sales report, the figures in September merely continue the drastic ugliness. The “rebound” from the summer is gone, which is distressing given that it wasn’t really a rebound just “less bad”, and even the seasonally-adjusted series contracted for the second straight month in September. The retail sales trend has, as identified above, already deviated from its pre-2012 recovery trajectory, and has clearly done so again on an even further downward slope. There can’t be much positive slope left to argue in favor of even a decent economy, let alone something close to repeating 3.9% on GDP in Q3 or the near future (which, by past correlation, should correlate to almost +6% retail sales, not another 2% with autos or -0.24% ex autos and food).
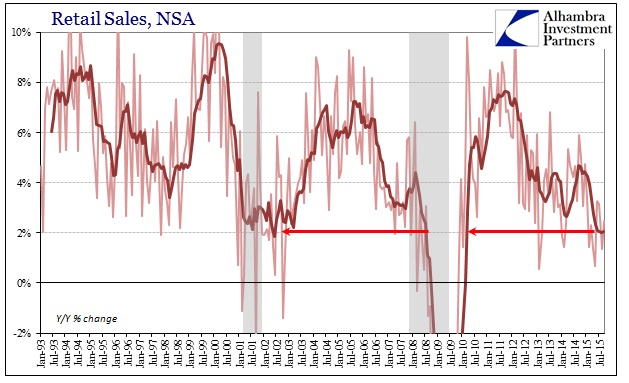
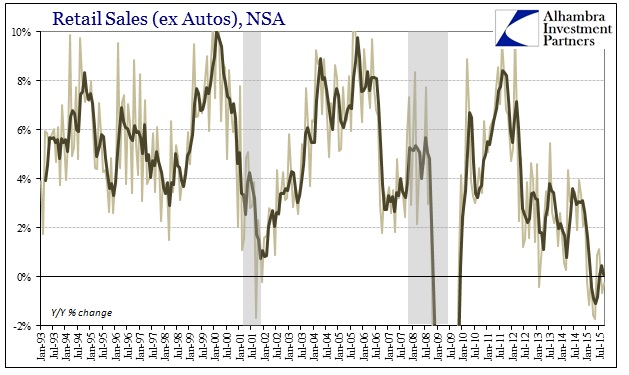
As we have been accustomed, September’s retail sales figures count still among the worst in the entire series and thus far against any GDP interpretations.
And relating retails sales as consumer spending to the Establishment Survey produces yet another strangely consistent disparity (which sounds like it should be an oxymoron). Jobs are supposed to be plentiful, but the BLS’s version of payroll accounting has produced no surge in spending; not even a steady growth in spending. From that we conclude either consumers are getting jobs but saving almost all those gains (in the aggregate), getting jobs that don’t pay much, or those jobs simply don’t exist outside of trend-cycle subjectivity. Again, none of those options lean in the direction of “transitory.”
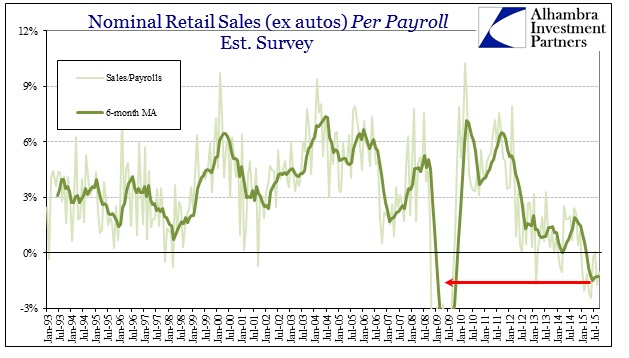
Prior to the 2012 slowdown there was a clear and positive correlation between retail sales and the Establishment Survey. As you can see above, there was no contraction during the dot-com recession because spending declined at almost the same rate as the payroll count – which is what you would expect. The serious contraction in 2009 was simply the magnitude of job losses being somewhat out of sync with consumer spending because of the shocking scale on both sides of that relationship. There is, however, no way to account for what you see after 2012 and especially in 2015 without concluding that highly adjusted figures are well out of alignment with the rest of the economic estimates.
As noted above, I think that accounts for the instability in GDP as an almost mathematical reconciliation between that ill-suited optimistic subjectivity and what is truly and depressingly (in more than one way) taking place. These spending figures suggest recession, particularly as the contraction/slowing has lingered now for more than three-quarters of a year. Snow and port strikes are so long ago that most people barely remember them, yet the spending figures remain the same long after those poor excuses have been so forcefully squeezed out of the reluctant mainstream narrative.
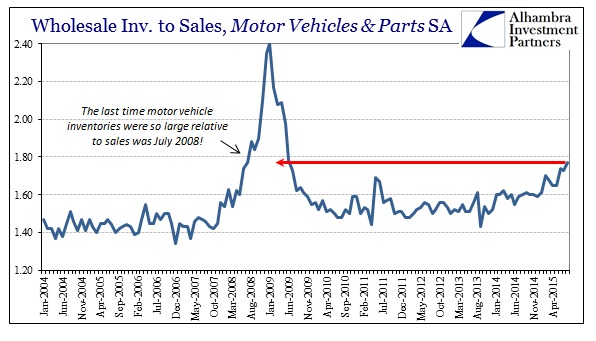
The economy is already in trouble as the breakdown in correlations strongly suggest. And it is retail sales that highlight how precarious that may already be if the full weight of recession remains looming. Auto sales remained somewhat robust in September, but as detailed last week in the wholesale figures, inventories for autos still gained almost 14% year-over-year in August, leaving the highest inventory level since the summer of 2008. So even with that credit-influence on consumerism, there is an overdue adjustment coming. Said adjustment can only be a further surge in broad sales, confirming that 3.9% GDP, or a massive cutback in production across the board. That’s a lot riding on just economists’ trend-cycle estimates, imputations and “seasonal” adjustments.