
The Commerce Department reported that retail sales rose 0.1% in November. The headline number represents the seasonally adjusted month to month change. Given the vagaries of the seasonal adjustment process, this may or may not be an accurate representation. Considering the tiny size of the statistically massaged rate of change, the odds are pretty high that the impression given by this number is wrong.
Furthermore, the number is not adjusted for inflation. Regardless of how “inflation” is defined, it usually adds a couple of percent to the annual growth rate in retail sales. The month to month change in the inflation rate can be volatile, but over the course of a year, the volume of retail sales after adjustment for inflation is usually a good deal less than the top line reports show.
The best way to measure retail sales is on the basis of actually surveyed sales, before any seasonally finagling, but adjusted for inflation. That allows us to estimate the change in the actual volume of sales. In other words, are people buying more stuff or less stuff? We aren’t interested in this case whether they’re paying more for the same amount of stuff. We just want to know how much stuff!
That’s the only way to accurately gauge and understand the momentum of the US economy. Using not seasonally manipulated data (NSA) we can’t tell whether sales were up 0.1% or not. But we can look at the actual change and tell how the month fared versus previous Novembers. I use a 10 year lookback period for that purpose.
Actual retail sales including inflation rose by 3.2% month to month in November. November is the beginning of the holiday shopping season and sales normally increase from October. The average November increase over the past 10 years was +1.6%. The current number was stronger than average, and the strongest reading in at least the last 11 years.
Shoppers saw the Trump election victory, figured the world was coming to an end, and said, “What the hell. We might as well go shopping.”
As a result of this strong pop, the annual growth rate rose to +5.3%. That was the second fastest growth momentum of 2016, after February’s sizzling 6.9% gain. The monthly oscillations left the average gain for the past 12 months near 3%.
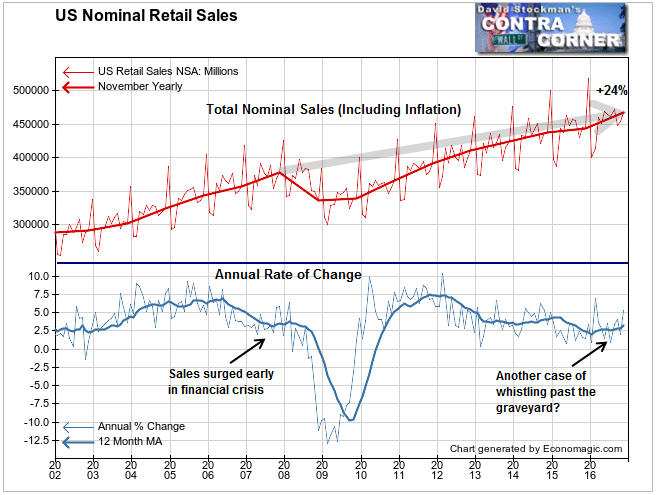
Lest we get too excited about this apparent sales acceleration, note that something similar occurred in 2007, just as the financial system was on the doorstep of collapse.
It had actually already begun to collapse. Only mainstream economists and media pundits failed to recognize the fact. They encouraged consumers to keep borrowing and spending. Then the bottom dropped out.
I suspect a similar process is under way today, as virtually everyone in the mainstream has bought into the ridiculous fantasy that Trump will boost the US economy to a longer period of stronger growth.
Aside from the assumptions upon which this apparent burst of spending was based, let’s keep the big picture in perspective. Nominal sales have risen 24% since the last retail sales peak in 2007. That’s a compound rate of about 2.4% per year.
Depending on how you like to measure retail inflation, it suggests that the real growth rate was somewhere around zero. Just like the Fed Funds rate. A lot of good that did.
I like to use the Producer Price Index for finished core consumer goods to adjust sales from nominal terms to real terms. I think that’s the best measure for reflecting the behavior of retailers in the market place. When their costs on the goods they purchase rises, the virtually always find a way to pass that increase through to consumers.
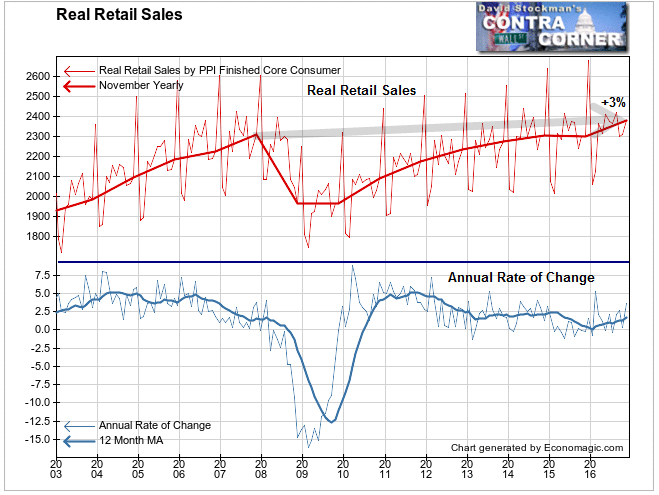
On that basis, sales did have a strong pop in November, because there was no increase in the inflation measure in November. The real gain in sales was therefore 3.2% from October, which again was the best November uptick in at least the last 11 years. I’ll attribute that to Trumpophoria.
That gain left the real annual increase at 3.6%, thanks entirely to the November pop. In October, the annual growth rate was languishing at +0.4%. Furthermore, the total gain in real sales since the 2007 peak was a mere 3%. Let me repeat that–a total of 3% in 9 years! In 8 of those years the Fed held interest rates near zero. In 6 of those years, the Fed was aggressively printing money.
Over those 9 years, while real sales grew 3%, US population grew by 7%. Real sales per capita actually fell 4%. That’s just more evidence that the standard of living of most Americans has been falling. Those in the top income strata keep spending, and inflation pads the top line numbers. But in the end, the nation is worse off.
The US economy is really no stronger now than it was in 2007. The country is 7% bigger, and that looks like intrinsic growth in the top line economic data. But in reality, it’s only population growth and income growth at the top of the spectrum. The base of the US consumption based economy is continually being hollowed out. It won’t be able to withstand a rise in interest rates for very long.
Everything looks great on the surface, but under these conditions a bear market is will probably dawn in the first half of 2017. The current stock market rally is a gift. A monthly program of materially trimming your stockholdings over the next 6 months is probably prudent.

