The mainstream media dutifully reported the Census Bureau’s May retail sales release last week. “Boo hoo,” they cried, “Sales fell 0.3% in May!” This, when everybody (economists’ consensus view) expected a 0.1% gain. Of course, these are nominal figures, so even a 0.1% gain would have been terrible, with CPI averaging nearly +0.2% per month.
The Wall Street Journal’s panic stricken headline and lead-in read like this:

A low unemployment rate and booming stock market would normally be a boon for U.S. retailers. But many instead are coming under growing pressure as Americans tighten their spending and look for bargains.
Retail sales—reflecting consumer spending at stores, restaurants and websites—fell 0.3% in May, the biggest decline since January 2016.
It was as if the Journal never noticed the trend of weak real retail sales that has been going on for a couple of years now.
But alas, none of it was true. The reported weakness in retail sales in May was an artifact of seasonal adjustment (SA). The numbers were way off this month.
Retail sales are following stock prices, just as always. Those who are not stockholders, which is most Americans, buy what they must, and can afford, which isn’t much. But stock owners are still giddily blowing the doors off of the retail stores, both brick and mortar, and online. Our illusion of stock market wealth sends us on periodic shopping sprees.
This orgy of buying will show up in the SA data eventually, probably next month. It misses one month, and overcompensates the next. This will encourage the Fed in its determination to shrink the balance sheet and end the orgy of asset inflation that has created this false sense of optimism.

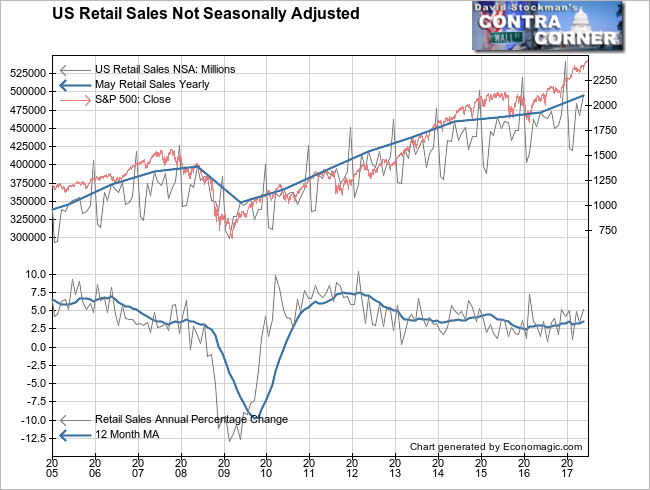
On an actual, not seasonally adjusted basis (NSA) sales rose 6% in May. They’re always up in May, so that’s not a big deal in itself. But they were better than May 2016’s gain of 4.2% and were right at the average gain of 6% for May in each of the preceding 10 years. In other words, this month was better than last year and no worse than average overall. It was far from the Wall Street Journal’s claim of the worst performance since January 2016.
The year to year gain was a booming, bubbly, frothy 5.2%. In terms of growth momentum, that was actually the strongest month of the last year. As you can see on the chart, nominal retail sales clearly follow the trend of stock prices.
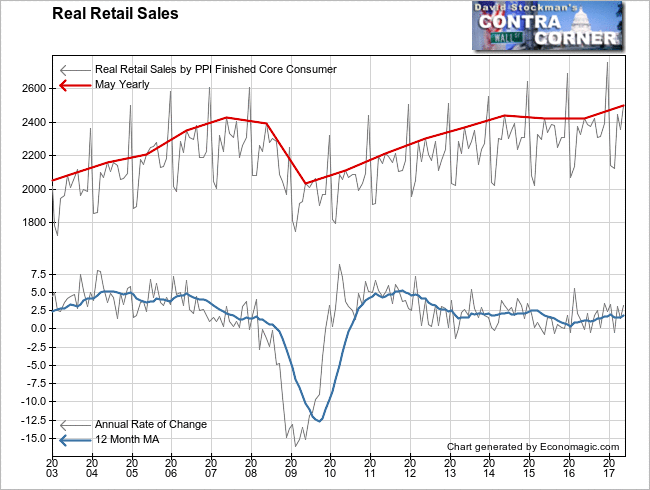
But these gains do not take price inflation of retail goods into account. Adjusted for inflation, the picture is not quite as ebullient in real retail sales. The month to month data was the same, but the yearly increase was more subdued at 3.3%. That was not outside the growth rate range of the past year, which has bounced around between -0.5% and +3.5%.
The 12 month moving average of the growth rate hasn’t changed much since last November. It’s around 3%, which is nothing to sneeze at. Yes, Virginia, there is a bubble, and fictitious wealth does burn holes in people’s pockets. It’s not sustainable without broad based gains in real disposable incomes. Those gains are still limited to the upper income strata, and our spending patterns ebb and flow. Soon enough it reaches a point of exhaustion.
That is likely to be a corollary of a declining stock market, which will come soon after (or maybe in anticipation of when) the Fed begins draining cash from the system. We’ve seen reports that the latest guess from the bankers in daily contact with the Fed is that that will start in September. Then the Fed will increase its drain rate throughout the following 12 months. As that progresses, there will be real pain.

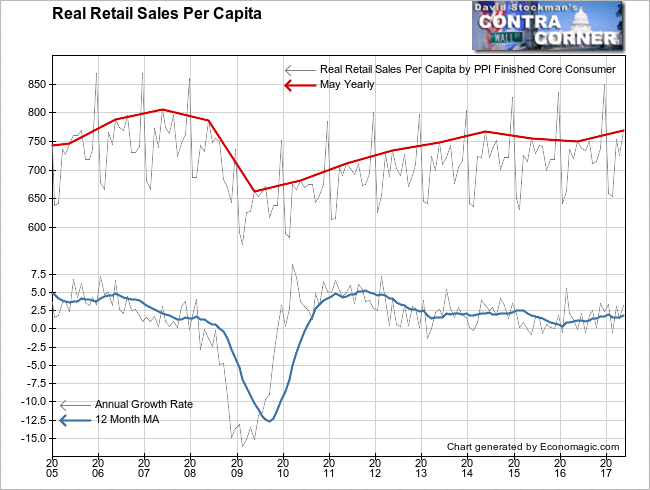
Lest we think that everything is hunky dory in retail right now, a look at real retail sales per capita should disabuse you of that notion. Keep in mind that those at the top are still skewing the per capita average to the upside when you examine this chart. Yes, there has been a slight uptick in the past year, but nowhere near the overall growth rates of 6% nominal and 3.3% real. Furthermore, after 8 years of economic “recovery,” real per capita sales remain below the levels of 2006, 2007, and even 2008, when the US economy was already well into recession.

Not that any of this matters to the Fed. As long as it sees the topline economic numbers increasing, it will remain hell bent on tightening. The Fed does not care that this is a tale of two economies where those at the top are skewing the data totals in a positive direction. Public comments of FOMC members have made clear that they want to prick this asset bubble, regardless of the fact that it will end the phony recovery, and that the greatest hardship is likely to fall, yet again, on what’s left of the middle class. As long as headline economic numbers are positive, the Fed will stay on course.
This month, the headline numbers were weak, but the truth is that the economy is getting a head of froth at the top. This froth will show up in the headline numbers again, probably next month.
Markets top out when the news is good because that’s what encourages central bankers to pull the punchbowl. The Fed will drain the bowl and leave it empty until the economic numbers really start to fall apart. We’re a good ways away from that. In fact, we’re at the stage of the market where, the more bullish the economic numbers are, the greater will be the complacency, both among investors, and among central bankers. That’s bearish. It’s the essence of a market top.
Beware.
Lee first reported in 2002 that Fed actions were driving US stock prices. He has tracked and reported on that relationship for his subscribers ever since. Try Lee’s groundbreaking reports on the Fed and the Monetary forces that drive market trends for 3 months risk free, with a full money back guarantee. Be in the know. Subscribe now, risk free!


