
Over the course of the last three week’s newsletters (subscribe for free e-delivery) I have discussed the ongoing topping process and the issuance of all three major “sell signals.” The importance of these signals is they have only simultaneously occurred at major market peaks.
“As shown in the chart below, not only have both lower sell signals been triggered by deterioration in price momentum, the short and long-term moving averages have now crossed.”
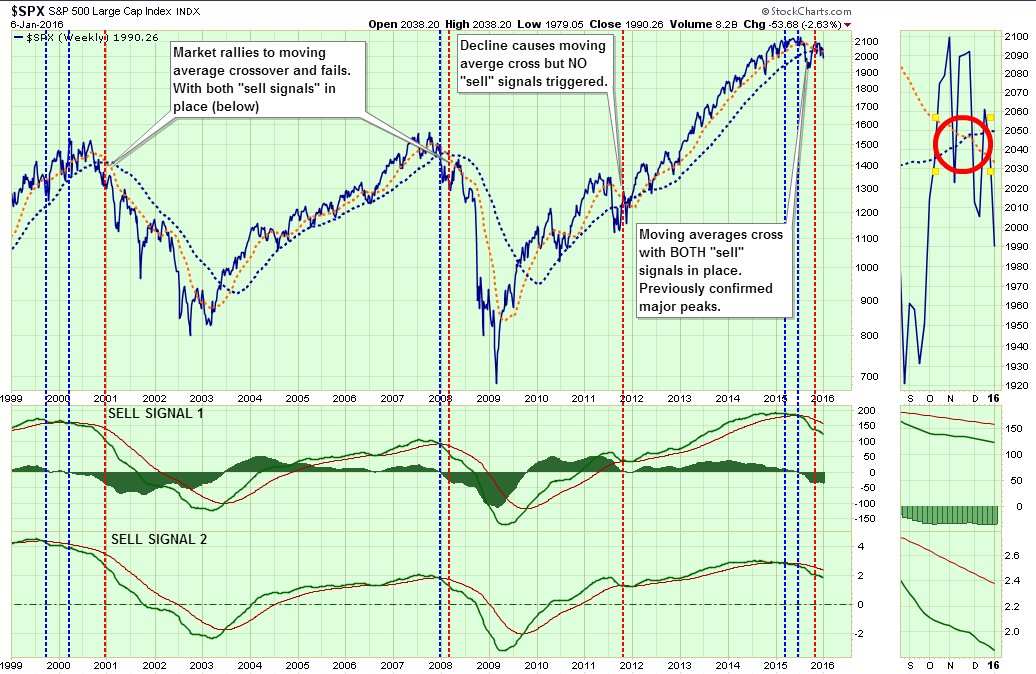
“Since the turn of the century, the two primary moving averages have only crossed three other times – at the peak of the markets in 2001 and early 2008, and in 2011. The difference in 2011 is that while the sharp decline in the prices due to the debt ceiling debate caused the moving averages to cross, the two lower sell signals were not triggered. This kept portfolios allocated more towards equities at that time.
The current topping process, as discussed on last week, is more akin to that seen in 2000 and early 2008. With primary moving averages now crossed, sell signals in place and markets trading below supports, rallies in equities should be used to rebalance portfolios and reduce risk.
While the markets are not ‘technically’ in a ‘bear market’ currently, it is important to remember that they weren’t in 2001 and early 2008 either. Waiting to make adjustments until after full recognition of the event doesn’t leave you many options.”
The problem for most investors during market sell-offs is the emotional desire to “panic sell” declines. Emotionally driven investment decisions never work out well.
No Bull, No Bear
Let me clarify something before I go further.
In the media, and on Wall Street, there is an overwhelming push to classify views as either bullish or bearish. This is a VERY dangerous thing for investors.
The reason I say this is since, in the words of Bob Farrell, “bull markets are more fun than bear markets,” investors tend to seek out “bullish” commentary to support their “hopes” of a continually rising bull market. The danger, as I have addressed in the past, is that individuals become “willfully blinded” to data that does not conform to their personal biases. This bias of seeking out only “confirming data,” known as “confirmation bias”, leads to decision making that is ultimately prone to error.
While I am personally tagged as a “bear” because I point out the inherent risks in investing, I assure you I am NOT a bear. I am also NOT a bull. I simply look at the relevant data and make determinations of risk based on historical precedents and statistical data.
As a portfolio manager of OTHER PEOPLE’S money, my biggest concern is not how much money I can make during market advances, but rather how much I keep from losing during market declines. While this seems counter-intuitive, it reality it is where long-term gains are actually generated. As William Lippman once quipped:
“Better to preserve capital on the downside rather than outperform on the upside”
Furthermore, it is a function of math.
Let’s assume an investor wants to compound their investments by 10% a year over a 5-year period.
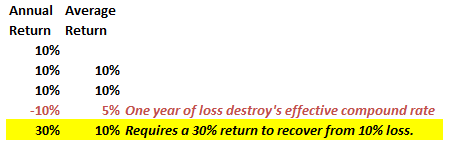
The “power of compounding” ONLY WORKS when you do not lose money. As shown, after three straight years of 10% returns, a drawdown of just 10% cuts the average annual compound growth rate by 50%. Furthermore, it then requires a 30% return to regain the average rate of return required. In reality, chasing returns is much less important to your long-term investment success than most believe.
In the end, it does not matter IF you are “bullish” or “bearish.” The reality is that both “bulls” and “bears” will be owned by the full-market cycle. However, what is grossly important in achieving long-term investment success is not necessarily being “right” during the first half of the cycle, but by not being “wrong” during the second half.
The Bear Awakens
Okay, with that said, let me be the “bear.”
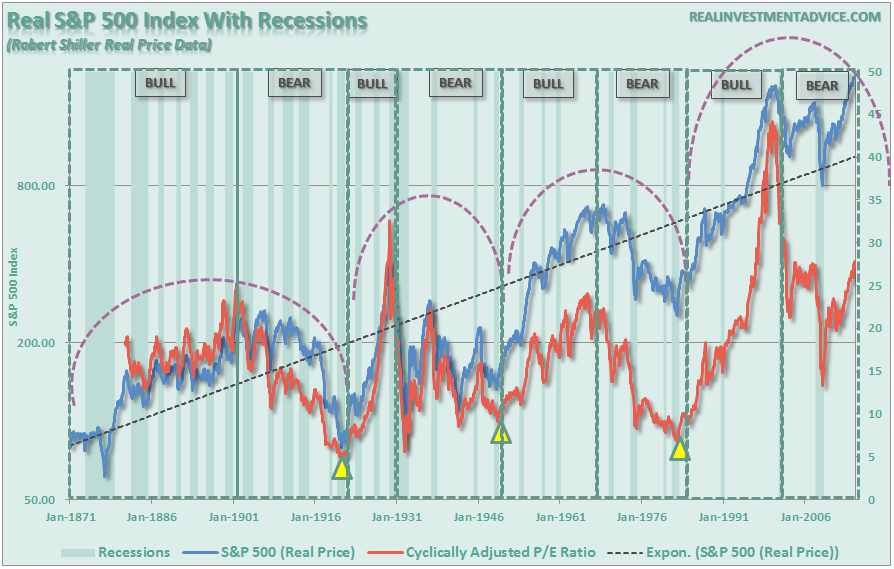
As I noted in the last paragraph above, there are two halves to a full-market cycle as shown below. Notice that peaks in valuations denotes the end of the first half of the full-market cycle.
The concept of the full-market cycle is critically important to understand considering the markets have very likely broken the bullish trend that began in 2009. Take a look at the first chart below.
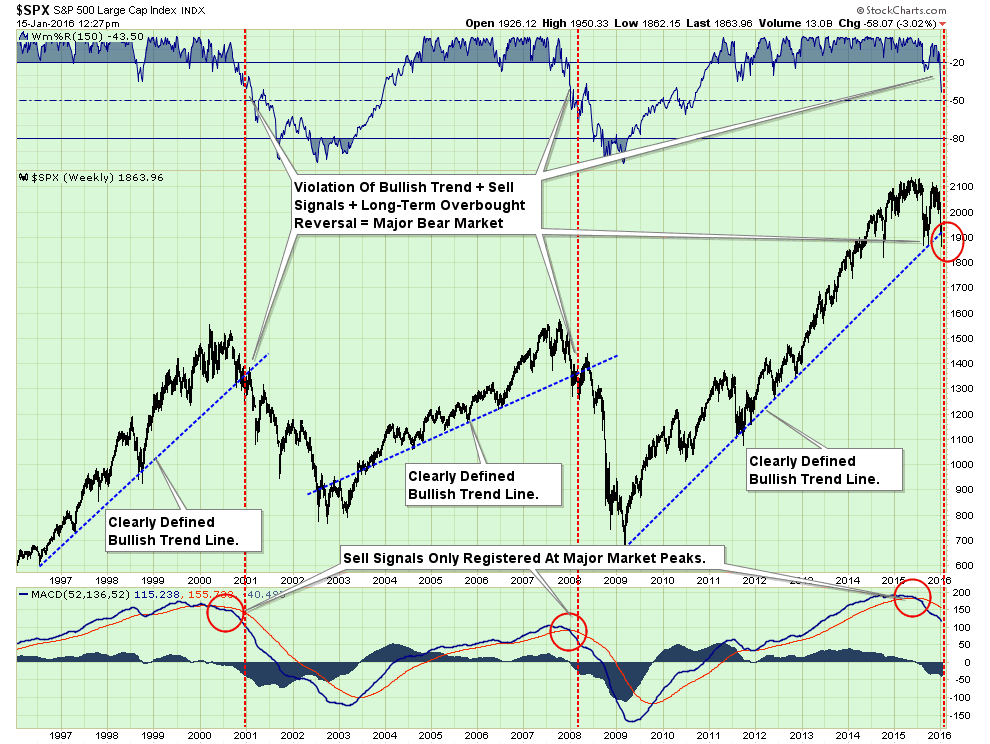
This “weekly” chart of the S&P 500 shows the bullish trends which were clearly defined during their advances in the late 1990’s, 2003-2007 and 2009-present. Each of these bullish advances, despite ongoing bullish calls to the contrary, ended rather badly with extremely similar circumstances: technical breakdowns, weakening economics, and deteriorating earnings.
As I have shown in the chart above, when the markets broke the bullish trends (blue dashed lines), the subsequent bear market occurred rather rapidly. The conversion from the bull market to the bear market was marked by a breakdown in prices and the issuance of a very long-term “sell signal” as noted in the bottom of the chart.
We can look at this same analysis a little differently and see much of the same evidence.
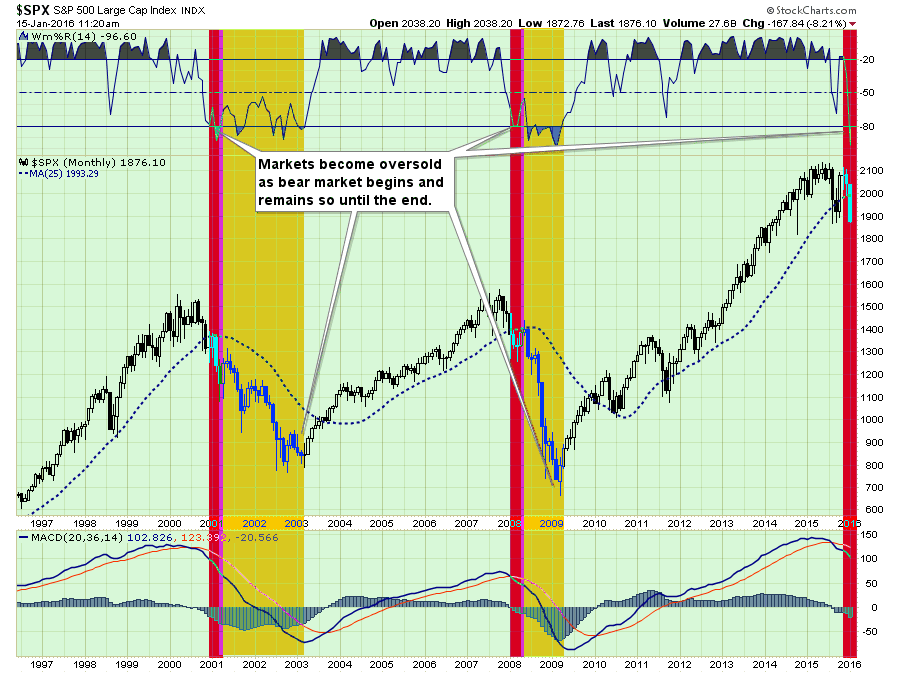
The chart above shows something I discussed last week:
“Markets crash when they’re oversold.”
When markets break their long-term bullish trend supports, combined with important long-term sell signals and a sharp decline in momentum, it has historically denoted the start of a “bearish market trend.” The red highlight denotes the start of the bear market and the yellow highlight shows the ensuing bear market completion. They are swift and brutal.
The next chart, which is the same as above, completes the analysis by pointing out the important signals showing the change in trend.

Looking For A Sellable Bounce
It is important to note that I am not suggesting “selling everything and buying guns and ammo.” Furthermore, for clarity, I HAVE NEVER suggested being in “all cash.” From a portfolio management standpoint, going from “all equity” to “all cash” and back again have never been a good idea. Trying to “time the market” is impossible to successfully replicate over multiple market cycles.
However, as I regularly write, it is our job to reduce portfolio risk to manageable levels to preserve capital over time. We can do that by increasing and reducing our exposure to equity-related risk by paying attention to the price trends of the market.
Currently, all of the longer-term technical trends are suggesting that the time has likely come to reduce equity risk to more manageable levels. However, that time is not today.
By the time markets register important “sell signals” which denote a change from the bullish to bearish trend, the markets are generally oversold from the selling that is creating the change of trend. This is, as shown in the chart below, always the case.
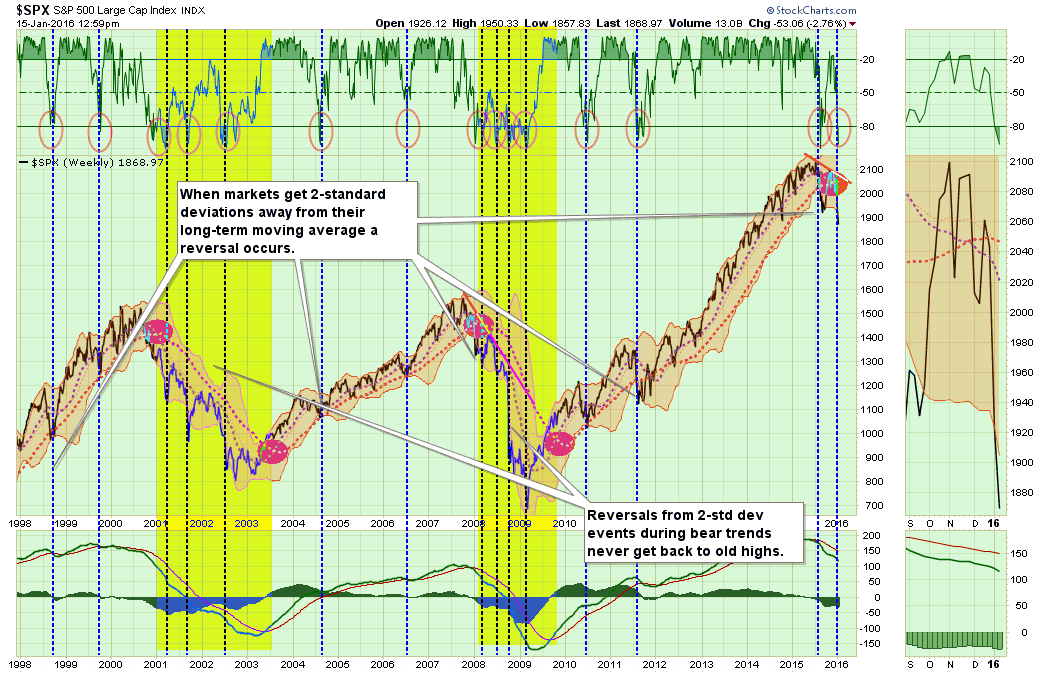
The top section of the chart is a basic “overbought / oversold” indicator with extreme levels of “oversold” conditions circled. The shaded area on the main part of the chart represents 2-standard deviations of price movement above and below the short-term moving average.
There a couple of very important things to take away from this chart.
- When markets begin a “bear market” cycle [which is identified by a moving average crossover (red circles) combined with a MACD sell-signal (lower part of chart)], the market remains in an oversold condition for extended periods (yellow highlighted areas.)
- More importantly, during these corrective cycles, market rallies fail to reach higher levels than the previous rally as the negative trend is reinforced.
Both of these conditions currently exist.
Does this mean that the markets will go straight down 20% without a bounce? Anything is possible. However, history suggests that even during bear market cycles investors should be patient and allow rallies to occur before making adjustments to portfolio risk. More often than not, it will keep you from panic selling a short-term market bottom.
Take a look at the daily price chart below.
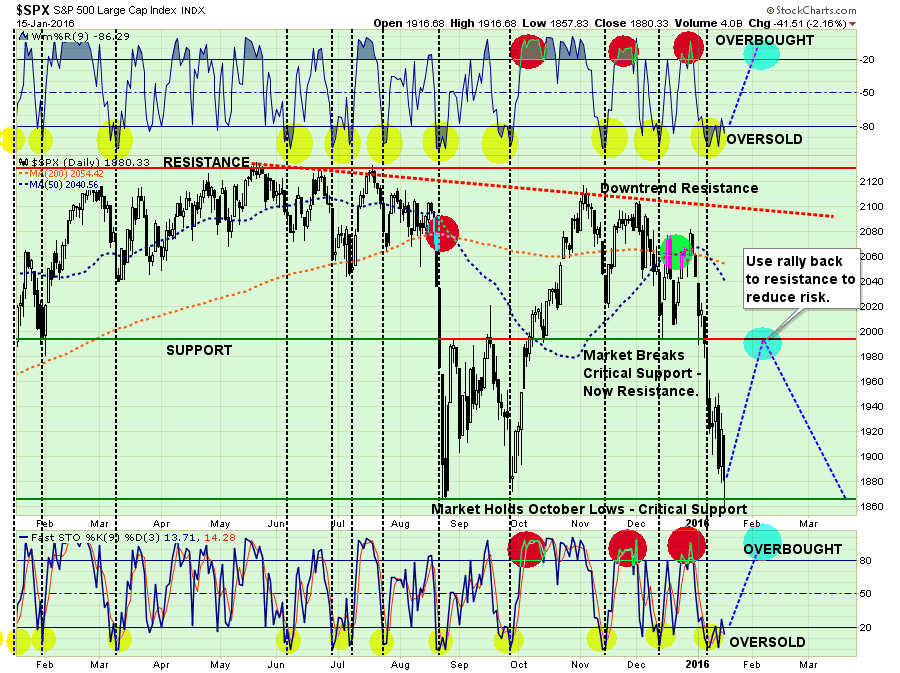
In particular note the top and bottom portions of the chart. These two indicators measure the “over bought” and “over sold” conditions of the market. You will notice that when these indicators get stretched to the downside, there is an effective “snap back” in fairly short order.
As I stated last week, chart updated from then:
“With the markets having issued multiple sell signals, broken very important support and both technical and fundamental deterioration in progress, it is suggested that investors use these “snap back” rallies to reduce equity risk in portfolios.”
While it is possible the markets could rally back to previous support at 1990, what we are looking for primarily is for current oversold conditions to be alleviated. Regardless of where the markets are trading, the time to begin reducing risk is when the short-term overbought conditions return.
Again, let me reiterate that I am not suggesting selling everything, but rather taking a prudent approach to managing risk in your portfolio by:
1) Trimming positions that are big winners in your portfolio back to their original portfolio weightings. (ie. Take profits)
2) Sell those positions that you are “hoping” will get back to even someday. They are losers now and will be bigger losers during the bear market.
3) Move trailing stop losses up to new levels.
4) Review your portfolio allocation relative to your risk tolerance. If you are aggressively weighted in equities at this point of the market cycle, you may want to try and recall how you felt during 2008. Raise cash levels and increase fixed income accordingly to reduce relative market exposure.
The Risk Of Being Wrong
Could I be wrong? Absolutely.
This entire outlook could literally change overnight if the Federal Reserve leaps into action with a rate cut, another liquidity program or direct market intervention.
If it does, then I will recommend a healthy dose of equity buying to increase risk in portfolios. Sure, I might miss a little of initial upside, but my portfolios will be quickly realigned to participate with a much higher reward to risk ratio than what currently exists.
If I am right, however, the preservation of capital during an ensuing market decline will provide a permanent portfolio advantage going forward. The true power of compounding is not found in the winning, but in the not losing.

Lance Roberts
Lance Roberts is a Chief Portfolio Strategist/Economist for Clarity Financial. He is also the host of “The Lance Roberts Show” and Chief Editor of the “Real Investment Advice” website and author of “Real Investment Daily” blog and “Real Investment Report“. Follow Lance on Facebook, Twitter, and Linked-In

