
The retail sales data series (and all of the subseries) have been revised with a new benchmark. If you believe in economic growth then the revision should have been upward by at least a significant amount. Instead, the updated view of retail sales is actually less than the brutal results we thought the first time around. The downward revisions were not immense, but they were apparent (though the chart below actually attempts to belie that conclusion).
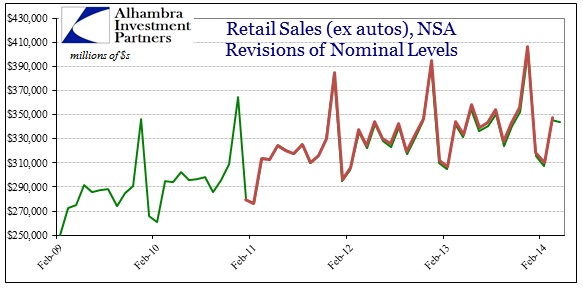 The largest downward revisions appeared in January and February this year. But it is not only the revisions that are important here, as retail sales have attained an increasing degree of monthly volatility. There is always monthly and seasonal volatility, yet it is obvious that has been enhanced since early 2012.
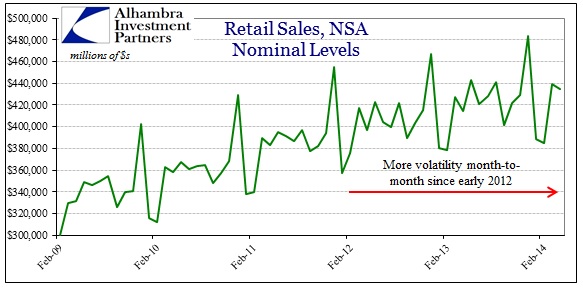
 So we see the growth rate diminished at the same time volatility rises, with both effects very much related. A period of “sustained growth” should emphasize both of the words, very much including the “sustained” part. It does little good toward building economic health where the growth of retail sales, for example, is wholly unstable. What we should see is 7% or better every month.
In fact, the last time retail sales growth was 7% was March 2012. What the economy has produced since is not even a steady 3% rate. Rather, 3% is now celebrated as an achievement. In the current pattern, 3% or 4% is the ceiling interspersed with far too many months of 1% or 2% (and a few closer to 0%). The average growth rate of retail sales right now is simply atrocious, not triumphant, rebound or not.

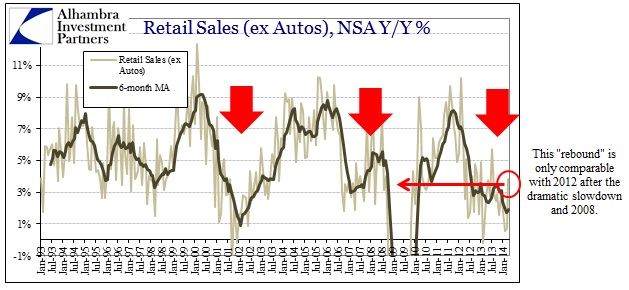
 Everywhere you look the average growth rate, smoothing out even the increase in volatility, remains very much the worst since 2009 (on the way down). If weather played any role in the recent descent, it must have been neutralized by the end of April. If it was simply households holding back spending, delaying purchases for more favorable temperatures, roads or perhaps more sunny dispositions and attitudes (who knows), the net between January and April should wash. In other words, March and April should have been a surge not just a respite.
So April’s figures did rebound from the earlier months, but there is no reason to believe that it was anything other than this monthly volatility – the ebb and flow of the economy. And now that we are well past the polar nonsenses, the cumulative balance of all these months is just plain bad. We are so far away from what might fairly and convincingly be called growth that recession is all that is left.
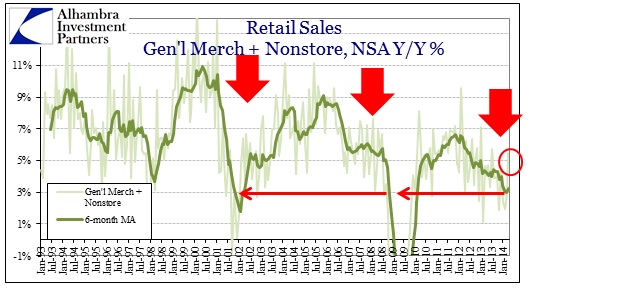
Not only is 2014 running below 2013 (when the opposite was promised as unquestionable – remember QE3-4 chest-thumping just before taper became a common buzzword?), the growth rate is below every other recession year except 2009 (with autos boosting 2014 only slightly above 2001-02).


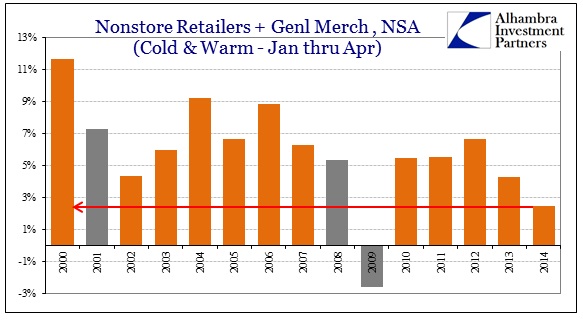 It doesn’t get any more plain than that, in terms of nearly everything – that 2013’s projections and assurances were complete bunk, as 2014’s are setting up to be; that autos is the only difference in the marginal economy relating to consumers (bifurcation); and that households are near the end without some kind of actual boost (as opposed to the Establishment Survey’s isolated and unconfirmed statistical intrigues). Again, that is why the volatility here is increasing at the same time the overall growth rate sinks.
This is the very definition of instability, and it is growing and festering. I continue to think some parts of the monetary establishment see at least the contours of this, though it will never be acknowledged in public for fear of offending rational expectations theory. To reiterate – we should be seeing at least 5% growth month after month after month to even support the idea of the “muddle”, rather than just hoping 5% comes up once in a great while. Current results certainly should not provoke an orthodox, mainstream carnival over just 3.5% and some downward benchmark revisions.
Click here to sign up for our free weekly e-newsletter.
“Wealth preservation and accumulation through thoughtful investing.”
For information on Alhambra Investment Partners’ money management services and global portfolio approach to capital preservation, contact us at: jhudak@alhambrapartners.com

