
Recession Probabilities Rise
As I penned earlier this week:
“Speaking of weather, last year, the BEA adjusted the ‘seasonal adjustment’ factors to compensate for the cold winter weather over the last couple of years that suppressed first quarter economic growth rates. (The irony here is that they adjusted adjustments for cold weather that generally occurs during winter.)
However, the problem with ‘tinkering’ with the numbers comes when you have an exceptionally warm winter. The new adjustment factors, which boosted Q1 economic growth during the last two years will now create a large over-estimation of activity for the first quarter of this year. This anomaly will boost the ‘bullish hope’ as the onset of a recession is delayed until those over-estimations are revised away over the course of the next year. ”
The reason I reiterate this point is due to a recent research note from Wells Fargo discussing the increased risk of a domestic recession. To wit:
“One possible way to summarize the results from all these models is to calculate the average of these probabilities and then examine historical performance of the average probability. The current average probability is 37.3 percent and this method predicted all recessions successfully since 1980 without producing any false positives (Figure 11). Different models utilize different predictors to capture the state of different sectors of the economy and therefore an average probability may reflect the average risk posed by these sectors.
At present, we are not calling for a recession within the next six months. However, given that the recession probabilities based on our official model and average of all models are somewhat elevated, it is not wise to dismiss recession risk.”
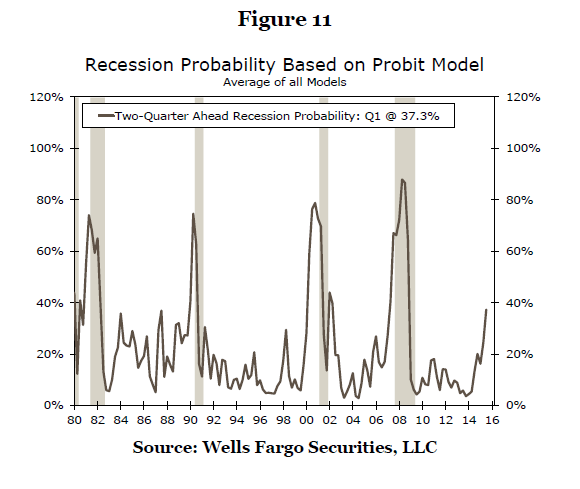
The combined Probit Model based on the entire series of indicators utilized by Wells Fargo, (which includes LEI, VIX, Yield Spread, Stock Prices, Commodities and more) also confirms the same recessionary stresses shown in the Economic Output Composite Index (EOCI).

(The EOCI Index is a composite of the Chicago Fed National Activity Index, ISM Composite, Several Fed Regional Surveys, Chicago PMI, LEI, and the NFIB Small Business Survey.)
As shown, the economy is currently operating at levels that have normally been associated with recessionary environments. The only thing that has kept the economy from registering a recession in the past has been the interventions by the Fed that have led to a “forward-pull” of future economic activity. (Beginnings and endings of QE programs noted by gold squares)
While there are many mainstream economists insisting that the U.S. economy is nowhere near recession, considering much of the current data will be negatively revised in the quarters ahead will likely prove those views wrong.
With economic data having remained extremely weak in recent months, it will NOT be surprising to see a short-term pickup in economic activity as a restocking cycle once again leads to temporary bounce. However, as we have repeatedly seen since 2009, those bounces in activity have been transient at best. Without monetary support from the Federal Reserve to once again “drag forward future consumption,” the risk of sliding into recession becomes a very real possibility.
The Decline Of The Middle Class
I have often written about the broad decline in the financial conditions of the middle class.
“There is a financial crisis on the horizon. It is a crisis that all the Central Bank interventions in the world cannot cure.
No, I am not talking about the next Lehman event or the next financial market meltdown. Although something akin to both will happen in the not-so-distant future. It is the lack of financial stability of the current, and next, generation that will shape the American landscape in the future.
The nonprofit National Institute on Retirement Security released a study in March stating that nearly 40 million working-age households (about 45 percent of the U.S. total) have no retirement savings at all. And those that do have retirement savings don’t have enough. As I discussed recently, the Federal Reserve’s 2013 Survey of consumer finances found that the mean holdings for families with retirement accounts was only $201,000.”
“Such levels of financial “savings” are hardly sufficient to support individuals through retirement. This is particularly the case as life expectancy has grown, and healthcare costs skyrocket in the latter stages of life due historically high levels of obesity and poor physical health. The lack of financial stability will ultimately shift almost entirely onto the already grossly underfunded welfare system.”
Just recently the Pew Research Center confirmed the same:
“After more than four decades of serving as the nation’s economic majority, the American middle class is now matched in number by those in the economic tiers above and below it. In early 2015, 120.8 million adults were in middle-income households, compared with 121.3 million in lower- and upper-income households combined, a demographic shift that could signal a tipping point, according to a new Pew Research Center analysis of government data.
In at least one sense, the shift represents economic progress: While the share of U.S. adults living in both upper- and lower-income households rose alongside the declining share in the middle from 1971 to 2015, the share in the upper-income tier grew more.”

“Over the same period, however, the nation’s aggregate household income has substantially shifted from middle-income to upper-income households, driven by the growing size of the upper-income tier and more rapid gains in income at the top.Fully 49% of U.S. aggregate income went to upper-income households in 2014, up from 29% in 1970. The share accruing to middle-income households was 43% in 2014, down substantially from 62% in 1970.
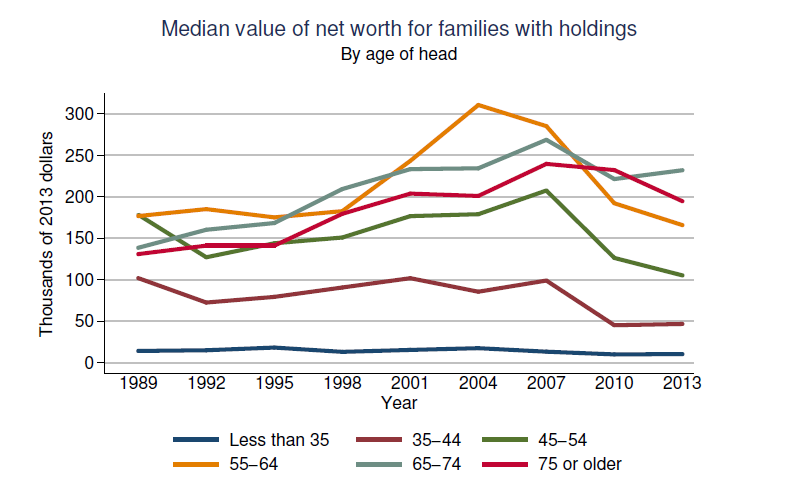
And middle-income Americans have fallen further behind financially in the new century. In 2014, the median income of these households was 4% less than in 2000. Moreover, because of the housing market crisis and the Great Recession of 2007-09, their median wealth (assets minus debts) fell by 28% from 2001 to 2013.”
Importantly, this is why economic growth remains weak. While the Federal Reserve was focused on boosting asset prices for the wealthy, they forgot to create an economic environment that was conducive to increasing the consumptive power of the middle-class and their near 70% participation in economic growth.
Oops.
The True Definition Of A Bear Market
The sharp rally over the last couple weeks, which has been primarily driven by massive short-covering, has brought the “bulls” out once again declaring the recent “bearish decline” over. However, is such really the case, or is this yet another of the many rallies we have seen as of late that ultimately fail?
In order to answer that question, we must first define what a bear market really is. The currently accepted definition of a “correction” is a 10% decline and an official “bear market” begins with a 20% fall in the market. However, both of these definitions are not accurate we have seen both such events occur during longer-term market trends.
For investors, the difference between a “bull” and a “bear” market, regardless of the short-term fluctuation in prices, is whether the overall “trend” in prices is rising or falling. When the “trend” is positive, speculating in the financial markets is advantageous as the “rising tide” increases the value of portfolios. Conversely, when the overall trend is “negative,” speculating in the financial markets has a generally negative result.
(We are not investors, we are speculators. Warren Buffett is an investor. When he invests in a company he can control its destiny by appointing operating managers, defining directives, etc. YOU are a speculator placing bets with your “savings” on ethereal pieces of paper that you “hope” will rise in price over time. Understanding this point is important.)
The utilization of a simple moving average is one way the overall trend of the market can be determined. A moving average is an “average” of prices over a given period of time. In order for there to be an average price, prices must have traded at two points of extreme over the sample period. If prices are generally “trending” higher, the average will be positively sloped as each new low and high point is greater than the last. The opposite is true when prices are generally “trending” lower.
Overall bullish and bearish trends are revealed when looking at longer-term price trends of the market. The chart below is an example.
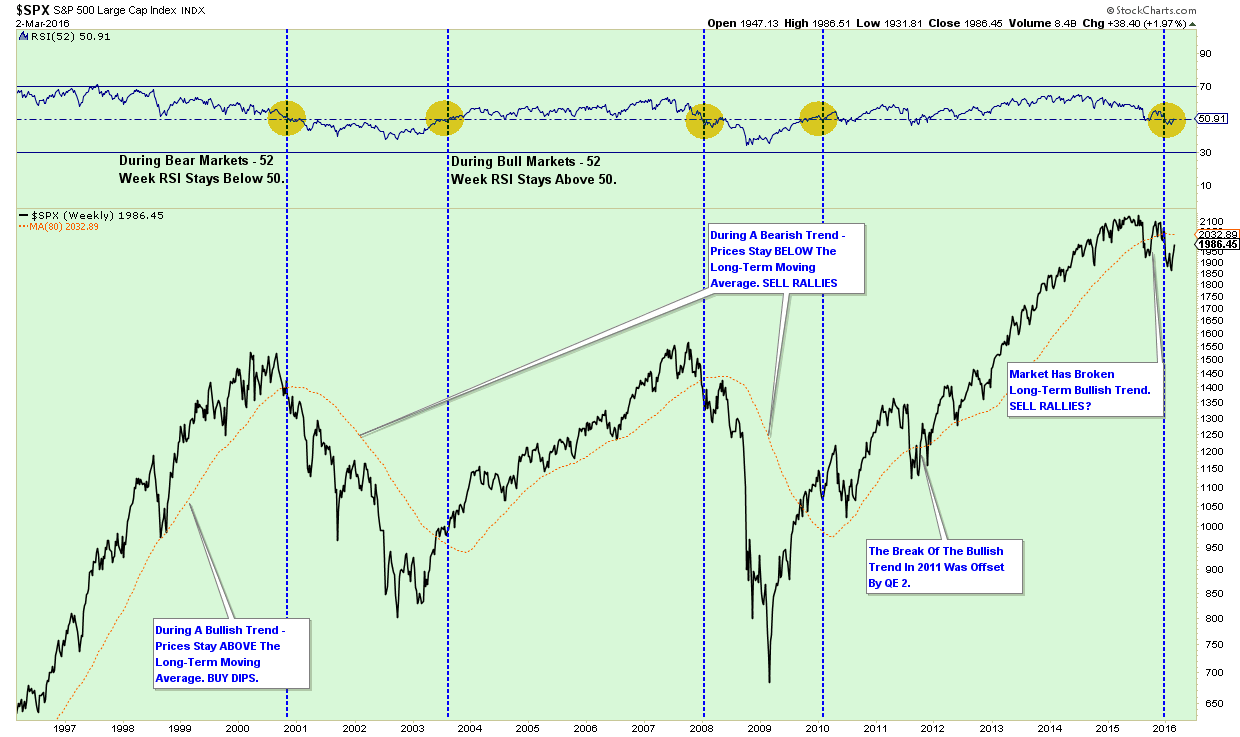
(Note: This is a WEEKLY price chart to smooth out short-term price volatility. We are using an 80-week moving average and a 52-week RSI for this example.)
During “Bull Markets” – prices tend to remain above an “upward” or “positively” sloping moving average. Also, the relative strength index (RSI) stays above 50 during that period.
During “Bear Markets” – prices tend to remain below a “downward” or “negatively” sloping moving average. RSI also remains below 50 during this period confirming a more “risk adverse” environment.
Currently, all indications currently suggest the markets are in the early stages of entering into a confirmed “bear market” as the longer term moving average is turning from a positive to a negative slope and RSI has fallen below 50.
Yes, things could change very quickly with the intervention of Central Bank action. The same was seen during the summer and fall of 2011 as then Fed Chairman Ben Bernanke quickly acted to stave off a more serious market decline. However, with the Fed more focused on “tightening” monetary policy currently, such a salvation seems to be a low probability event.
The value in changing your definition of a “bear market” is by waiting to lose 20% of your portfolio before acting, it takes a 33% subsequent rise in the market to get back to even. That is “time” lost that you can never regain.
As stated earlier this week, the rules for managing your portfolio are relatively simple:
- In rising market trends – buy dips.
- In declining market trends – sell rallies.
Despite the ongoing “hopes” of the always bullish media, the recent rally has not changed the slope, or scope, of current market dynamics. Caution is still advised.
Just some things to think about.
Lance Roberts

Lance Roberts is a Chief Portfolio Strategist/Economist for Clarity Financial. He is also the host of “The Lance Roberts Show” and Chief Editor of the “Real Investment Advice” website and author of “Real Investment Daily” blog and “Real Investment Report“. Follow Lance on Facebook, Twitter, and Linked-In

