
The juxtaposition could not be more fitting with all that is transpiring at this moment in economic history. On Monday, the headlines were filled with, Black Friday Fizzles as Sales Tumble 11% and ‘Black Friday’ Fades as Weekend Retail Sinks 11%. Then the “employment” report comes out and now the headlines are, More Jobs and Higher Wages: U.S. Recovery Starts to Hit Home and Hiring Surge Gives U.S. Expansion a Lift Into 2015. The problem is one of mutual exclusivity as both narratives are totally inconsistent with each other even when factoring any kind of shift in consumer buying patterns.
The shopping trend is itself a statistical creation, but one with more raw and basic grounding in actual outcomes. The Establishment Survey is, to put it mildly, one of the most adjusted and calibrated (not to mention revised) figures in the economic calendar. That is especially true of its inclusion of a statistical process called “trend/cycle analysis” and that supposition’s close relation to the plucking model of economic cycles past (and way in the past now). You can obviously tell from just that initial formulation where my sensitivities and inclinations take my analysis.
The problem starts and ends with our current economic circumstances, particularly as it looks nothing like historical experience with other business cycle occurrences. We are conditioned to think these economic statistics are good indications of actual economic condition, but that only applies if the future (or the current) looks like the past where these “rules” were all developed.
The former head of the BLS, who was in that position until 2012, told the New York Post last year exactly that:
All parts of Washington’s data-collecting machine adjust to smooth out the bumps caused by the seasons of the year. But the recession that started five years ago was so severe and the recovery so anemic that the seasonal adjustments have been thrown off.
I would add that I don’t believe it is just seasonal adjustments have been affected, but that it goes deeper to their very benchmarks (the Establishment Survey really only measures variation). To use a sports analogy, baseball statistics were thrown way off comparing the game in the 1960’s to 1980’s and early 1990’s to the steroid era that followed. The game never changed, nor did how the statistics were calculated, but the players sure did (especially the hitters). It becomes impossible to use a single suite of statistics to compare pitchers in, say, 1977 vs. their counterparts in 1997.
If there was the best run of job growth and payroll expansion in “years” then that should show up someplace else, and in the most important figures. You would expect that at the very least payroll taxes would be extremely robust because you can’t have a job without paying taxes (allegedly).
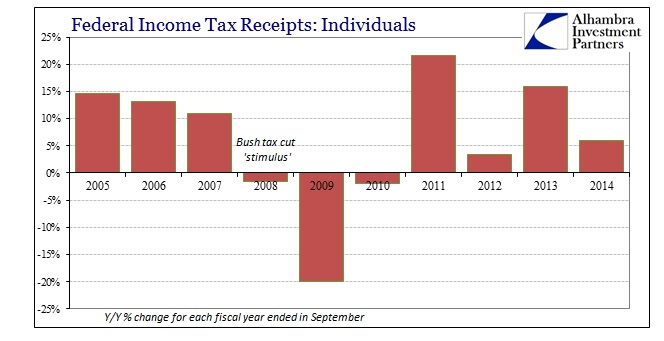
There are tax law and rate changes to consider when comparing tax receipts from one fiscal year to the next, but overall these conform closely to combined observations about growth – with the notable exception of 2014. That becomes even more stark when observing the breakdown between individual withheld and non-withheld.

How can there be the same growth rate in withholdings in 2014, which includes FICA, as 2011? The tax cut “stimulus” of a reduced FICA rate applied in FY 2011 but not in 2014, meaning that holding all variables constant, as economists like to do, the economy or payroll expansion in 2014 must be lower or reduced compared to 2011 which wasn’t all that great. In fact, receipts from withheld income in 2008 were just shy of the same 4% seen in 2014, which is also seriously below the 6.7% average from 2005-07.
In non-withheld income the picture is even worse. This segment composes individual taxes paid to the treasury by quarterly estimates. Because of the nature of income driving estimated payments, this segment of individual taxation is rather sensitive to the economy.

Again, you see the pattern at about what you would expect of the Great Recession “cycle.” The problem is that 2014 showed only 7% growth, or just a bit more than half of 2007 and not much better than 2008. In other words, tax receipts, which are actual dollar figures unadjusted by statistical conventions, are not matching the Establishment Survey or the unemployment rate. There is absolutely no evidence to suggest we have just witnessed the best jobs market in decades; rather to the contrary, the pace of taxation is looking quite sparse and paltry.
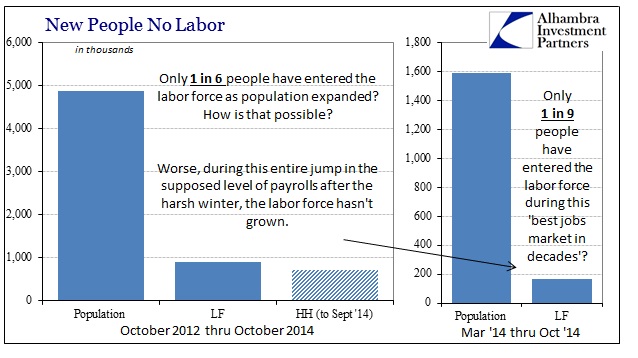
That, of course, leads to the usual conversation and presentation about the payroll statistics for the latest month. Again, the labor force does not match the “narrative” either, instead quite corroborative of tax receipts.
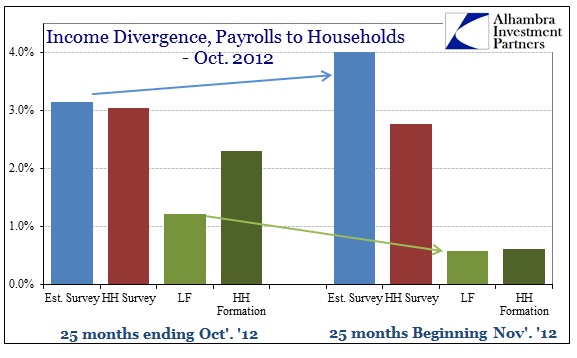

I think at this point, if you think the economy is growing and poised upon a major breakout that nothing here will change your mind. Supposition works in both directions, and rightly so. But anyone that looks at these payroll reports and views them the least bit skeptical, especially how it doesn’t, like the election, match individual perceptions, then there is much to be said about statistical systems where data series diverge significantly.
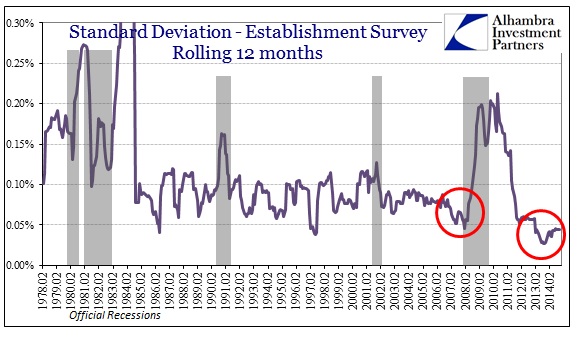
I find it extremely odd and troubling that starting with January 2013, the Establishment Survey started moving in nearly an exactly straight line (benchmarks are important). That observation is made more curious by a memo that was just sent out by the Census Bureau to its field offices (the BLS crunches the numbers, but contracts out with the Census Bureau to actually conduct the surveys).
These harsh conditions were disclosed in the agreement attached to an Oct. 1 memo — both of which were obtained by The Post — from William Hatcher, associate director of field operations. The memo itself didn’t get to workers until mid-November, according to sources.
In the memo, Hatcher tells workers that Census wanted to maintain its “unblemished reputation for producing quality data.”
In other words, they were told that there would be penalties for cheating on the surveys, which apparently is tied to suggestions of a rash of field workers completing surveys for people never actually surveyed. The reason for doing so, spelled out by the New York Post, is that compensation is tied to a 90% completion rate.
Again, make of that what you will, but I think that this all more than suggests that even the most mainstream of statistics need proper skepticism and thus corroboration. The mystery of Black Friday was not that people were too busy working to shop as might have been the case if the payroll report was as “unblemished” as under past economic circumstances of the plucking model, or something close to it. More simply, I think the ability of these statistics to produce close correlations with other facets of economic monitoring and accounting has been seriously compromised at least by the disparity in data sets and perhaps even more nefariously.
Oil prices and yield curves would certainly concur, as would a huge swath of the electorate in the developed world (with emerging markets none too enthused about all this assumed robust US growth either).

