
Demand indicators for the Treasury market weakened modestly over the past month. These trends don’t yet exhibit the usual precursors of improvement. If the weakening persists, bond prices should break to the downside within weeks, and stocks should follow.
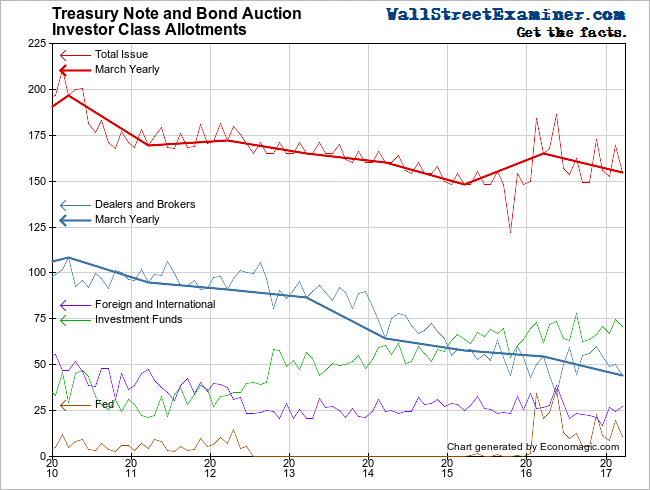
The Primary Dealers positions are the most important. As new supply increased last month, the dealers took down less of it. They are reducing their interest rate risk in long duration paper. Meanwhile, investment funds, the dumb money, have been taking down more bonds.
Dealers were net long cash Treasuries versus futures by approximately $3 billion at the beginning of the month. This is a new annual low, below their smallest net long position of the past year of $9 billion. If this trend continues, and particularly if it goes net short, it would mark a sea change in Primary Dealer positioning. It would be a bearish sign.
Total demand for Treasuries has been in a secular decline. Bonds remain on the brink of signaling a long term bear market, in spite of stepping back from the brink over the past week. Bond yields flirting with an upside breakout haven’t phased stock market bulls. They need to show a little more respect for the prospect of a weaker bond market, or they’re going to get their butts kicked.
Here are some of the bearish indications that investors need to pay attention to.
The total bid at the March Treasury auctions was $453 billion, up about $5 billion from March 2016. Demand has stabilized over the past year, but the long term trend is still down. This is part of a secular trend that has persisted since 2010. There’s no evidence, nor any reason to think, that this will change in the foreseeable future.
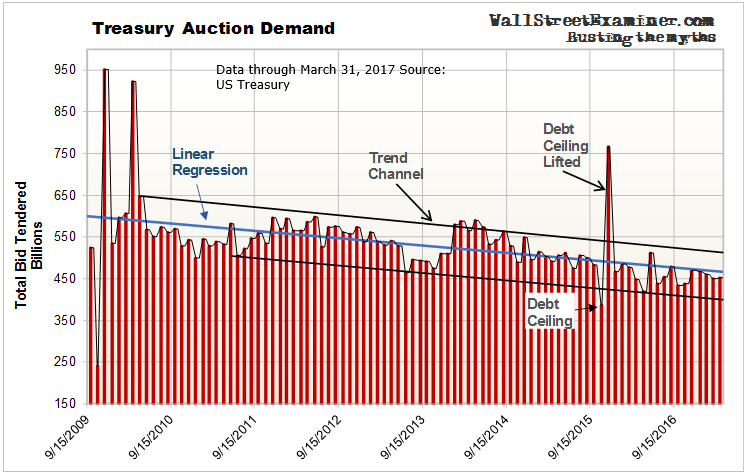
At the same time, a big increase in supply is looming once the debt ceiling is lifted and the Treasury will need to raise funds to repay the internal accounts it raided. Any increase in spending, and/or any tax cuts would add to Treasury issuance as deficits grow. If demand doesn’t increase along with the increase in supply, bond yields will rise.
Treasury bond issuance is lower than last March, but it is above the March 2015 level. Meanwhile dealers are taking a much smaller share as their purchases remain in a sharp downtrend. With large holdings already, the dealers are less willing to accumulate longer term paper. They have been persistently lowering their exposure to interest rate risk in longer duration paper. Dealers are the “smart money.” Investment fund buying—“the dumb money”— continues to trend higher.
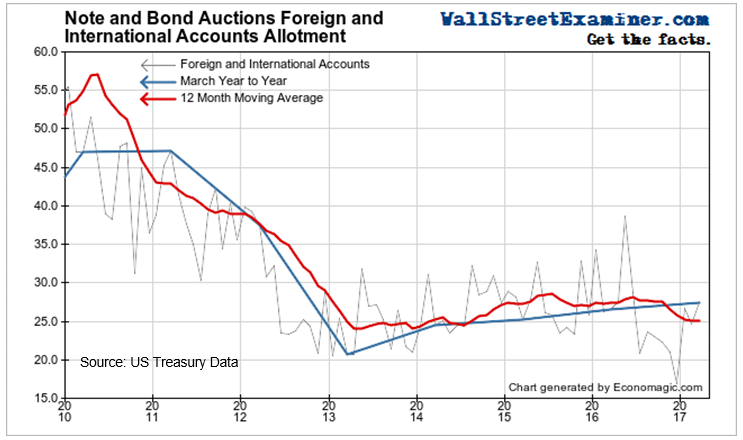
Foreign allocations rose slightly on a year to year basis in March. This very modest rise was enough to help keep a bid under bond prices. However, the low overall level of buying shows that this is not a strong vote of confidence.
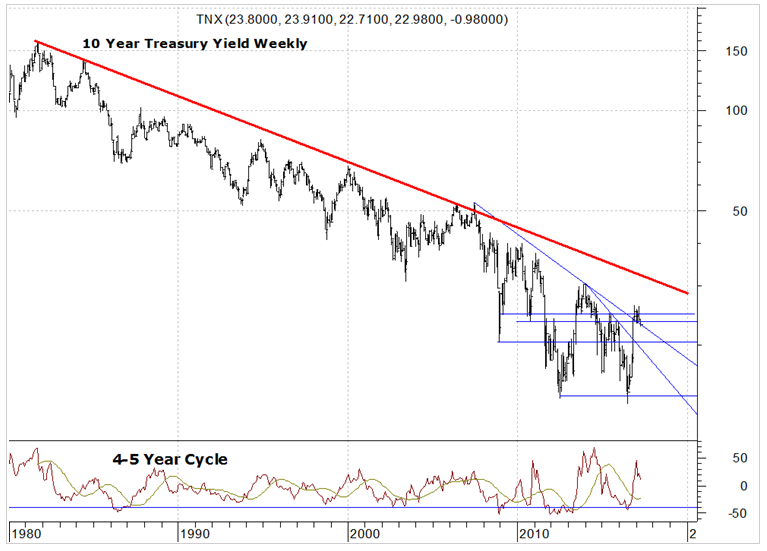
The 10 year yield has pulled back to the 10 year trendline that it broke to the upside in December. If it holds here, the next target would be the secular trendline at 3%. If yield drops below 2.25, the next target would be around 2.05 based on this chart. That could still be a bottoming pattern for yields. 35 year trends don’t reverse in a day.
Primary Dealers cut their Treasury coupon long positions as well as Agencies and corporates in the 4 weeks ended March 29. It was the third straight month in which they cut their corporate holdings. They increased their holdings of MBS. They have maintained large long positions in Treasuries for the past 18 months in spite of the big selloff in the second half of 2016. Their long positions in Treasuries have recently been oscillating around the 1 year moving average, which has turned flat and may be rolling over.
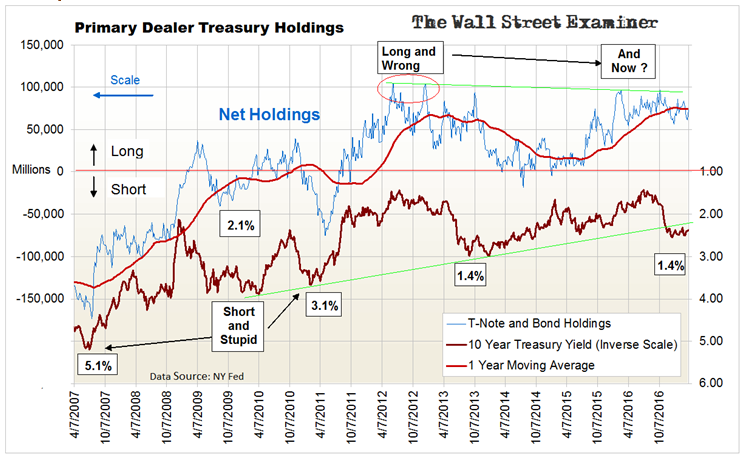
The dealers hedge their cash positions in the futures markets. For the week ended April 4, 2017 dealer positions in Treasury coupon futures of all durations were net short approximately 562,000 contracts with a face value of $69.3 billion. That was sharp drop in short positions from the face value of $84.3 billion at the end of February.
This reversed 4 straight monthly increase in their net short positions in futures. But they reduced their cash long positions in the preceding week. The change in the futures positions was a hedge, not an increased bet on the long side.
The value of their long cash positions in T-notes and bonds was $72.6 billion, down from $84 billion 4 weeks before. On balance, considering both the futures and cash positions, the dealers were net long cash Treasuries versus futures by approximately $3 billion, down from $5 billion 4 weeks before. This is below their smallest net long position of the past year of $9 billion set last August. If this trend continues, and particularly if it goes net short, it would mark a sea change in Primary Dealer positioning. It would be a bearish sign.
Foreign central bank buying may have peaked. The Fed’s custodial holdings of Treasuries and Agencies for FCBs rose by $17.3 billion for the 4 weeks ended April 5. But it was a downturn from a peak the week before. This sets up a short term lower high, which could mean that the FCB buying cycle has topped out. That buying helped to provide additional liquidity for US markets. A downturn here would leave both US stocks and bonds vulnerable to a selloff.
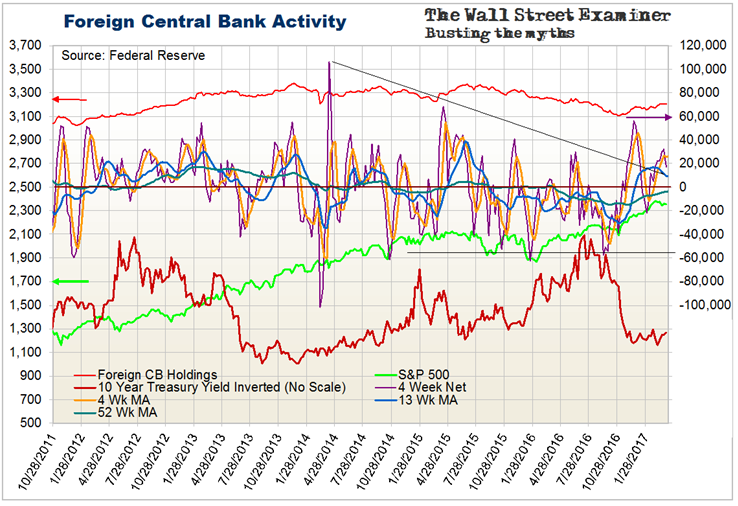
The overwhelming demand for dollars around the world had been causing dollars to pile up in the reserves of FCBs. They then recirculate those excess dollars into the purchase of US Treasury securities. Despite the FCBs recirculating a tidal wave of dollars back into the Treasury market, it did not cause a decline in bond yields. Instead, yields have remained firm. This shows just how weak demand from other buyers has been. Despite this week’s firmness in yields, the bond market remains at risk.
US banks have begun reducing their Treasury holdings. US commercial bank holdings of Treasuries and Agencies fell by $13.4 billion in the 4 weeks ended March 29. The 4-week moving average has dropped to a one year low. But this isn’t a level that has been oversold historically.
The 13-week moving average has been gradually sinking and has dropped below the zero line. The last time the 13-week MA was this low was in 2015. The bond market mounted a rally from there. So far, there’s no sign of a similar occurrence on this chart. Bond yields continue to oscillate in a tight range between 2.30 and 2.60.
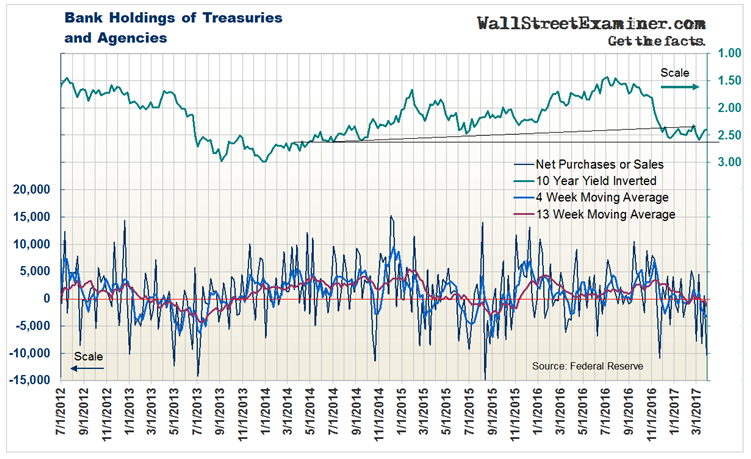
While this bank data indicates increased potential for an upturn in in bank buying, the intermediate trend remains bearish. If this line drops further into negative territory, the odds would favor resumption of the decline in bond prices and rise in yields. However, if banks increase their buying, a bearish move in the bond market could be staved off for a while longer.
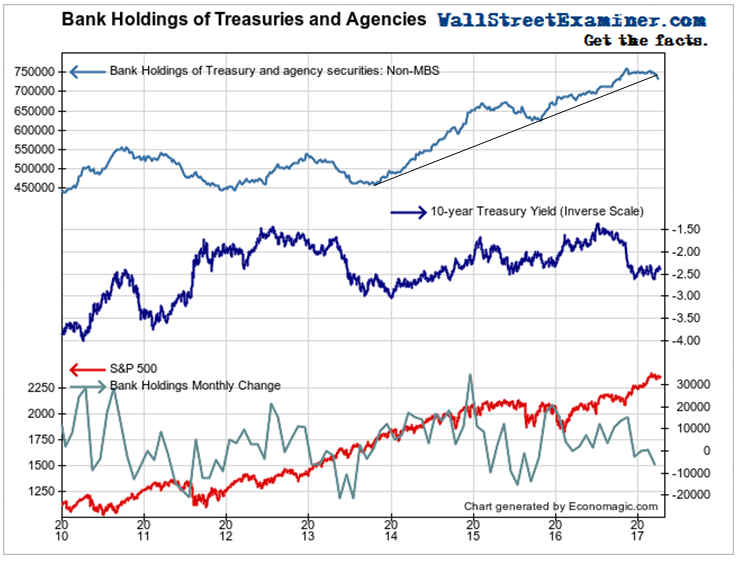
Bank buying is now on the verge of breaking a 3 ½ year uptrend. The monthly change indicator has been making lower highs since the end of 2014 as banks have slowed their buying over time. These are clear bearish signs for both stocks and bonds. If the trend of bank buying doesn’t reverse soon, bond prices should resume their decline. Stocks should follow.
This report is excerpted from Lee Adler’s Wall Street Examiner Pro Trader Monthly Treasury Supply and Demand Report.
Lee first reported in 2002 that Fed actions were driving US stock prices. The US Treasury has also played a role in directly moving markets. Lee has tracked and reported on those relationships for his subscribers for the last 15 years, helping to identify major turning points in the markets in their earliest stages. Try Lee’s groundbreaking reports on the Fed and the Monetary forces that drive market trends for 3 months risk free, with a full money back guarantee. Be in the know. Subscribe now, risk free!

