
By Tyler Durden at ZeroHedge
Speak of the quant devil: only earlier today we were referencing the most recent warning by JPM’s quant guru, Marko Kolanovic, and lo and behold, just minutes later the man with the impeccable record of picking market inflection point released a new report which contains his most dire market forecast yet for 2016.
Here are his latest comments with the key sections bolded by us:
Over the past month, the market rose despite mixed fundamental data, weak seasonal patterns, and nearing risk from catalysts such as Brexit. In our view, recent gains did not have much justification in fundamentals or investors’ psychology (‘climbing a wall of worry’) but were significantly driven by inflows from systematic strategies. Our analysis suggests that most of the technical buying is now exhausted and leverage in the system is high. Convexity of option market makers have also turned negative, supporting higher realized volatility in the near future. As we analyze below, other important market participants – pension funds, hedge funds, corporates (buybacks), retail investors and foreign investors – are less likely to provide significant support for the market near term. The weak technical, seasonal, and flow trends pose elevated downside risk for equities, in our view.
Kolanovic then breaks down technical exposure, and fund flows in a way only he can:
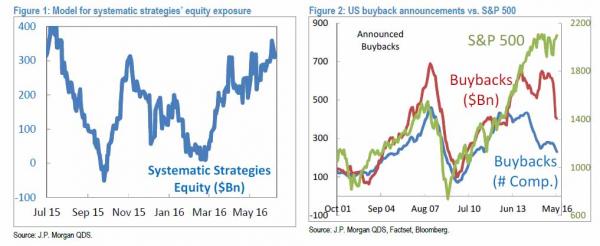
S&P 500 realized volatility (e.g., 3 months) is now at its lowest point since the summer of 2014. In addition to comfort provided by central banks, option-related flows over the past 2 months were suppressing market realized volatility and contributed to the buildup of leverage in systematic strategies. As a result, Volatility Targeting portfolios and Risk Parity strategies likely run near record historical levels of equity exposure. With equity momentum turning positive a week ago (across short-, medium- and long-term lookback windows) for S&P 500, trend following strategies (CTAs) are also net long equities. However, the CTA equity exposure is not high as the signal is not robust and momentum signals in Japan and European equities are negative. Figure 1 shows our estimate of total equity exposure across various systematic strategies over the past year. High levels of equity exposure, currently in the ~90th historical percentile, indicate high market risk posed by a potential increase of market volatility. Equity exposure of Hedge Funds is also above average – the equity beta of a broad HF benchmark (HFRXGL) is in the ~65th percentile, and equity exposure of Long-Short Hedge Funds is in the ~60th historical percentile. While Hedge Funds do have room to increase equity exposure, they are by no means underinvested.
But while Kolanovic’s recent bearishness is hardly new, where the JPM quant stands out is with his amazing ability to explain the key catalysts responsible for major market inflection points. He has done that this time as well, and in this case Kolanovic says that the driver for a spike in volatility will be $1 trillion in expiring S&P 500 options. This also explains yesterday’s unprecedented move in the VIX higher, which however was oddly enough not met with a matching drop in the S&P, which recall closed the day down only 0.8%.
About ~$1,000Bn of S&P 500 options expire this week. The gamma imbalance turned towards puts yesterday ($9bn per 1% currently), and this will likely push realized volatility higher near term. Post expiry, clients are likely to roll put strikes higher, which will also be supportive of higher volatility. Yesterday’s large move on the VIX indicates short gamma exposure of dealers on VIX products as well.
Further risk comes from the dramatic slowdown in corporate buybacks in recent months, which will no longer provide a buffer in case of a selloff:
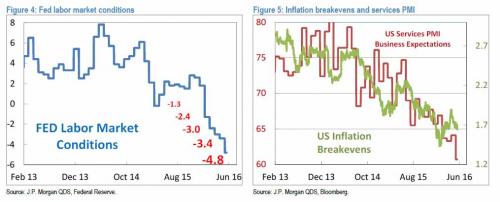
Over the past few years, Corporate Buybacks provided significant support for US equity markets. Close to ~$2,000bn of stocks were repurchased by corporates since 2013. However, the announced buybacks are now slowing down at a dramatic pace. On a trailing 12-month basis, announced buybacks dropped by $250bn (~40% drop). Given that on average it takes ~6 quarters to execute, this may translate into ~$40bn per quarter of reduced demand for equities. Figure 2 plots S&P 500 levels against the amount of announced buybacks. Our view is that the impact of the buyback slowdown has not yet reached the market. In fact, executed buybacks picked up in Q4 2015 and Q1 2016 as accelerated share repurchase (ASR) programs took advantage of market selloffs. That added ~$30bn of demand for stocks during market selloffs and helped stabilize the market in September and February (alongside a reduction of secondary offerings of ~$35bn). With ASRs exhausted, the dynamics for equities is less favorable. The striking divergence between the S&P 500 price and buyback slowdown (shown in Figure 2) also point to increased equity risk.
* * *
That’s the bad news. Now it gets worse, because after dispensing with the technicals, Kolanovic proceeds to muse somewhat philosophically over a scenario that would presage a far worse outcome than a mere 10-20% decline in stock prices. Namely, a world where central bankers lose control.
Central Bank Alchemy: In recent years, central banks across the world were lowering rates, buying assets, and pushing investors into riskier assets in an attempt to boost growth. Recent bond and currency price trends in Japan show some success in this alchemy: the government is issuing bonds and central bank is buying most of the issuance. While this is dilutive to private bond holders and increases credit and inflation risk, both bonds and Yen are appreciating at the same time.This appears to create value out of nothing (and achieves what medieval alchemy could not).The ECB has been recently extending purchases to speculative bonds (e.g., Telecom Italia, which is speculative grade according to Moody’s and S&P), and pushing rates deeper into negative territory, defying investment logic. In recent years, the Fed has managed to condition US equity investors that ‘bad fundamental developments’ may be good for risky assets, as we could recently see with the lack of market reaction to May’s disappointing payroll report. In addition, its recent interpretation of trends in macroeconomic data could be seen as somewhat controversial (Fed: “ … expect that the positive forces supporting employment growth and higher inflation will continue to outweigh the negative ones,” June 6, 2016). Figure 4 and Figure 5 show recent deterioration in Fed labor market conditions index, US inflation breakevens (5Y5Y) as well as US Services PMI business expectation index.
The conclusion:
While we believe that fundamentals are likely pointing to downside risk for equities (and perhaps bonds as well), it is possible that central banks continue to dominate prices of risky assets prices and bonds. For this reason, we continue to recommend a risk barbell portfolio in which an investor holds both reflationary assets (EM equities, commodities, Value assets) and hedging assets for the possibility that central banks lose their grip on asset price action.
Needless to say, when central banks do “lose grip on asset price action”, only one part of the “barbell” will work: the one that involves assets that have zero counterparty risk, assets which over the past 5,000 years have been dubbed to be “barbarous relics” and yet whose value has outlived each and every central planner in the history of the world.

