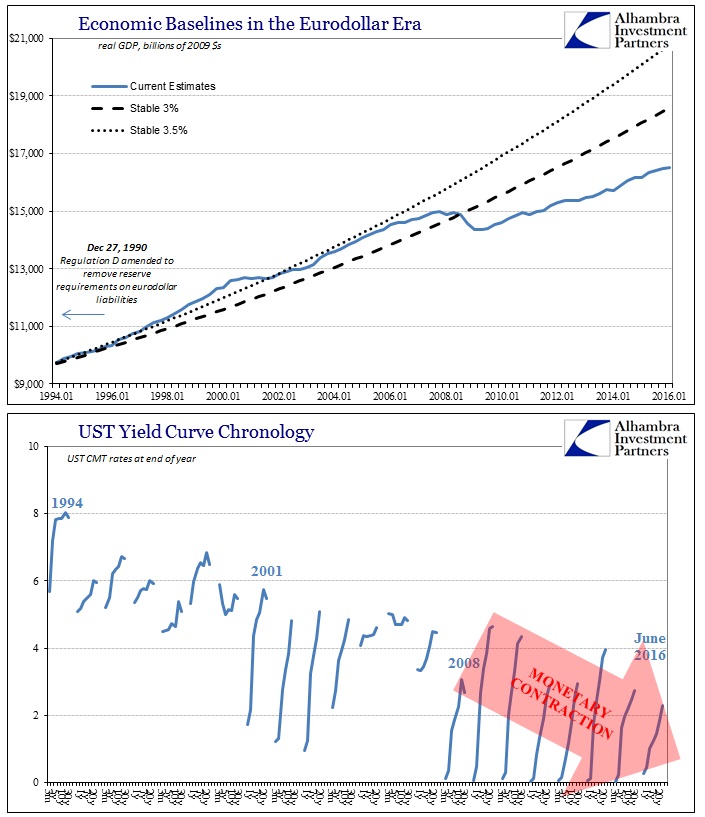
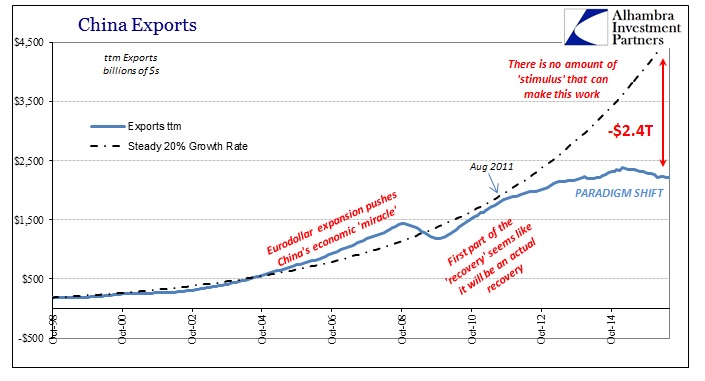
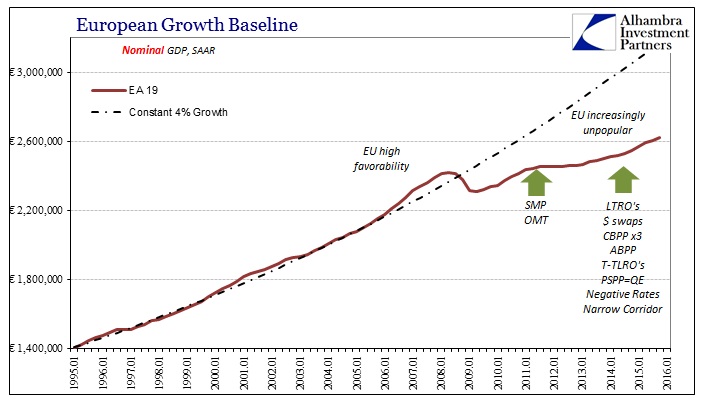
We have to acknowledge that economic statistics are imperfect even under the best conditions. But that doesn’t mean we shouldn’t try to measure comparative circumstances where conditions are less than ideal or conventional. In terms of a business cycle, we think of recession as negative GDP; to the point that conventional “wisdom” actually believes two consecutive quarters defines one. Not even the NBER describes their “job” that way.
Because our current economic circumstances don’t fit in the traditional cyclical mold, we are left to some extent making raw judgments about the state of the economy and ultimately about just how impaired it is. The purpose of doing so is the hope of figuring how further impaired it might become. Undisciplined comparisons run high risk of being misleading even with the best intentions. Instead, if we refashion how we see both recession cycles and whatever it is currently underway, we can start to really add depth to where we are, how we got here, and then project (hopefully) a more realistic expectation for economic circumstances in both the immediate future and beyond.
In my view, the biggest difference is time and the cost of it in the form of lost compounded growth. It is a financial concept but one no less relevant to economic conditions. That is, after all, what a recession actually is; lost opportunity, only kept to a relatively short or temporary deviation. Thus, it is somewhat helpful to figure opportunity cost in recession as the deviation of whatever real economic account from its pre-cycle peak baseline.
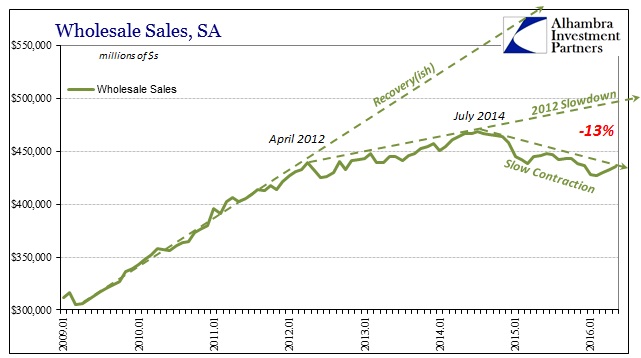
The problem with the US economy under the “rising dollar” is that it isn’t immediately clear which baseline is most appropriate. Further, incorporating only the latest number, as I did yesterday with wholesale sales, is too one-dimensional, leaving off the most important element of time.
Continuing with wholesale sales as an experimental proxy (we could just as easily use retail sales, factory orders, US imports, etc.) because it was relatively mildly affected by each of the past two official cycles, we can begin to calibrate the time concept starting with the dot-com recession. That cycle was itself somewhat unique in that it was mild in recession but then weak in recovery (the constant reference and criticism of the “jobless” recovery was entirely appropriate). And so the GDP inferences don’t really give us much idea as the combined cost of the overall deviation of the dot-com “cycle” both recession and its full recovery as a function of time.
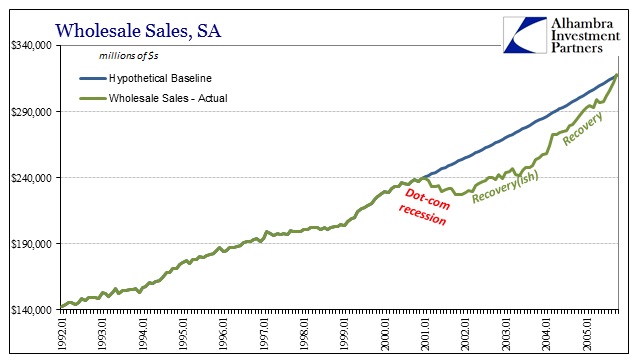
My goal here is not to put precise figures together about exact costs, rather only to use consistent methodology to make rough and general comparisons in order to see how much these techniques fit with the overall economic circumstances viewed more qualitatively. In terms of wholesale sales, as you can see above the overall cyclical gap was large more so on the time axis than in the direction of immediate recession. It took the economy, in the wholesale sales proxy, an enormous 58 months to close the gap to full recovery.
The overall “cost” of the cycle was thus $1.15 trillion; but that number in isolation is relatively meaningless. The total of actual wholesale sales during those 58 months was by comparison $14.9 trillion. By simple arithmetic of what the economy “would” have done under the constant baseline growth scenario ($16.1 trillion), the entire cycle “cost” the economy about 7.2% in lost activity.
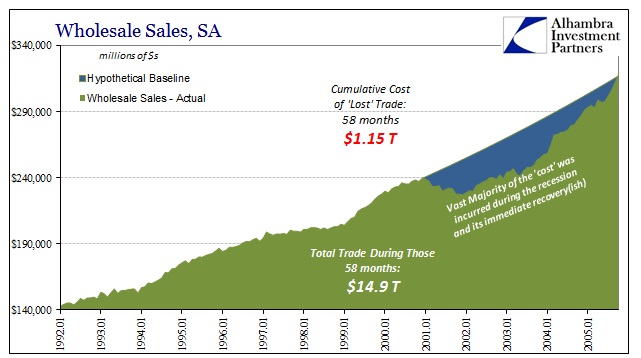
What is really important, in my view, is not just that estimate for a price tag but really that a great deal of the cyclical cost was incurred due to the weak recovery and not just the recession itself. Had the full recovery begun in 2002 instead of 2004, our estimate for the cyclical “cost” would have been cut in half! It puts the housing bubble and the economic inefficiency of it into perspective. In short, the dot-com cycle was “expensive” due to time not recession. That may further account for the severity of the Great Recession as an underlying indication of weakness/fragility before it ever began.
Having made these observations and calibrated them to the dot-com cycle, we can then push forward to the Great Recession. What we find there is exactly what you would expect – it was enormous and all condensed into a relatively short space of time.
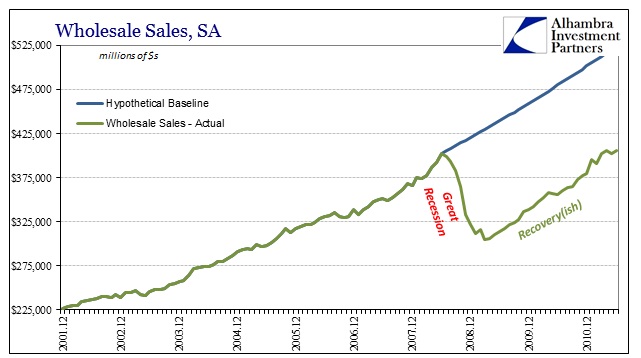
In only 13 months, the “cost” of lost wholesale sales just about matched the entire “cost” of the 58 months of the dot-com cycle (not accounting for inflation). By July 2009, just after the official end of the Great Recession, the cumulative total of lost activity was $1.13 trillion but on a base of just $4.4 trillion. That enormous 21% gap fits very well with what we qualitatively believe of the magnitude of the Great Recession.
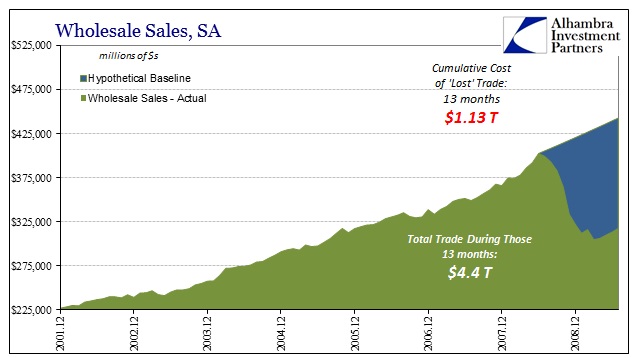
Like the dot-com cycle, however, a bigger “cost” to the economy has been the lack of recovery. Running the same numbers through June 2011, and what was really the end of the eurodollar part of the recovery, the overall gap increases not just in absolute terms but in relatively terms, too. In other words, the cumulative gap in those three years (36 months) to the middle of 2011 was nearly $4 trillion; total wholesale sales during those same months was $12.8 trillion, leaving the cost in percentage terms even more than during the GR itself: 23%. It suggests that the economy was actually getting worse even in the first stages of “recovery” that, in this post-crisis period, most closely resembled recovery.
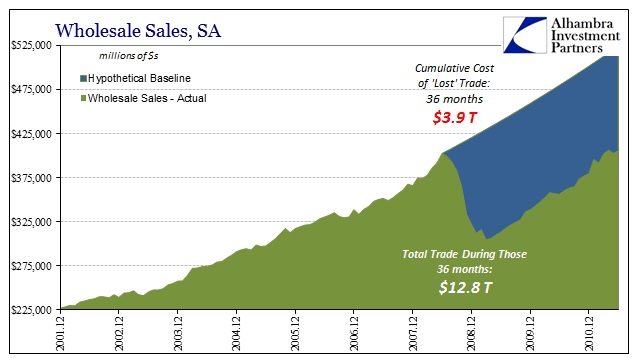
Running the numbers all the way through to 2016 shows only an enormous and growing gap. Based on the 2007 baseline, a full recovery after the Great Recession would have put the level of wholesale sales in May 2016 at about $808 billion; the estimate for May was instead $435 billion. Because the 2012 slowdown trend only pushed wholesale sales further away from recovery, the relative, cumulative gap between actual sales and what “should” have occurred is now about 30% (total wholesale sales in the 95 months since July 2008 were $39.2 trillion, but they “would” have been $55.9 trillion had the GR never occurred).
As much as these figures seem fanciful and unrealistic, they do fit with what we observe in other places, particularly the labor force. The proportions aren’t directly comparable, nor would we expect them to be, but overall what these progressions suggest is an economy that greatly and permanently shrunk – exactly the same interpretation of labor utilization in the US. Despite the use of terms like “full employment” and the often quite glowing projections for always “next year”, the wholesale sales proxy for economic condition is far closer to describing a world with increasing unrest economically, socially and politically.
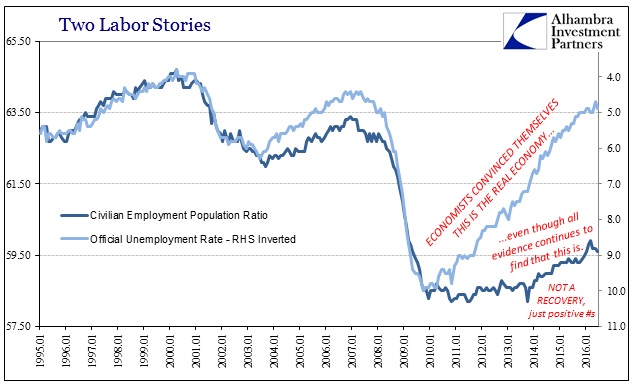
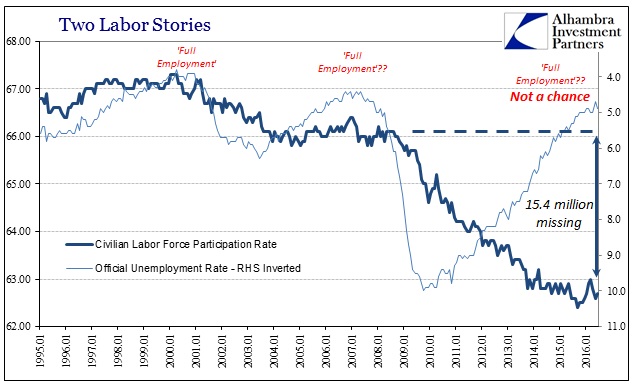
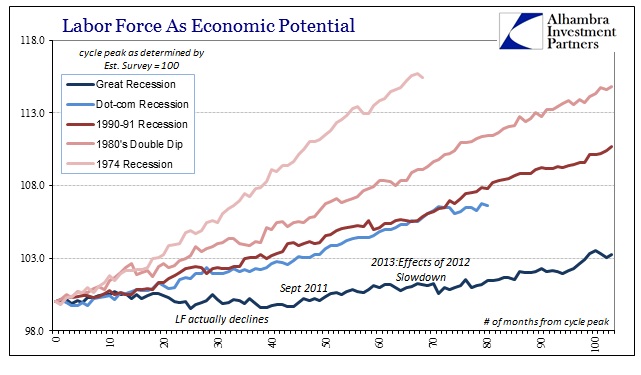
What is perhaps most relevant to 2016 is that increasing “cost” of the time component in the context of the “rising dollar” or “global turmoil” economy. The lack of recovery to 2011 and 2012 was an additional “cost” on top of the Great Recession, but then the 2012 slowdown (as noted above) further added to it and then was even further amplified by the economy after the middle of 2014. In terms of our wholesale sales comparison model, the additional “cost” of the slow and steady contraction of this so far non-recession is even greater than the dot-com recession.
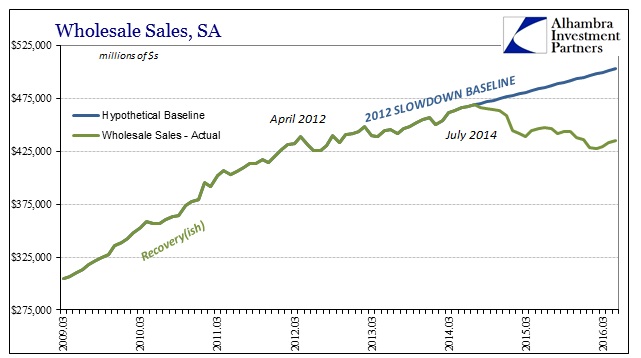
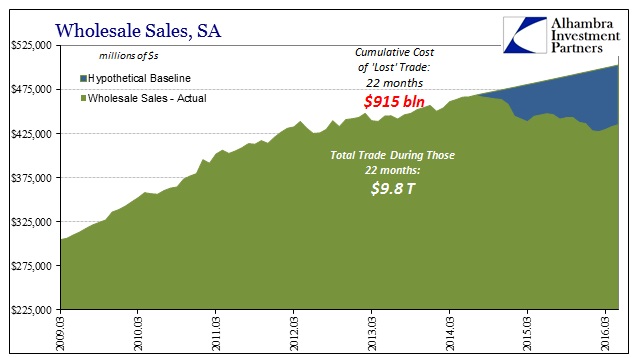
In the 22 months of deviation from just the 2012 baseline (not even considering the 2007 baseline), the total of lost activity in wholesale sales is almost twice what was experienced in the first 22 months of the dot-com cycle (again, not accounting for inflation); in that time during this undeclared recession-like condition, the total gap is already almost as much as the entire 58 months of the mid-2000’s cycle. In percentage terms, the gap is just more than 8.5%, also higher.
What we have, then, is a non-recession that so far is comparative in these cost terms to a mild one with the further outlook of a great deal more of lost time. Worse, this all follows the enormous setback of the Great Recession itself and its aftermath (that was so severe the labor force actually shrunk, too), meaning the economy’s overall condition is far, far worse than what is determined by the narrow terms of cyclicality. Economists who see no declared recession are thus surprised to find a real economy that behaves consistently unlike what should occur in a normal growth stage. There is only prevalent and spreading sickness that defies the traditional binary options.
Recession or not recession doesn’t matter; the economy is clearly malfunctioning and doing so in what appears to be permanent fashion, or what some have called secular stagnation. However, even term itself understates the severity of what we are facing, especially since even those economists who are open enough to recognize the possibility still refuse to see its most obvious correlation and likely cause. At least in this respect, using wholesale sales as a proxy or guide, the post-GR global economy makes sense.
The purpose of this exercise, then, is to try to quantify the immense “cost” of secular (monetary) stagnation far beyond cyclical terms and the statistics (like GDP) that depend a great deal on such determinations (trend-cycle). In very general terms, it shows both how little the economy actually healed after 2009 and now that the impairment is seriously increasing yet again. It quantifies highly unstable circumstances, economy, financially and beyond.
