
In this past weekend’s newsletter, I reviewed the current fundamental, economic and technical backdrop of the market following the March rebound from the recent lows which was front running the ECB’s monetary policy decision.
“The question, of course, is whether the ECB’s interventions will be able to change the longer-term dynamics in the Eurozone by creating inflationary pressures and sparking economic growth? That answer is likely “no” as it has failed to do so in the past, not only in the Eurozone but also in Japan and the U.S.
In order for the market to change the current negative dynamics, which in turn would warrant a significant increase in long-term equity exposure, it will require a uniform improvement in the technical underpinnings and likely a breakout to all-time highs.“
As shown below, the very short-term technical trend still remains negative as the recent rally pushing into resistance at both the downtrend and the 200-dma. It is also worth noting that the 50-dma is still trading well below the 200-dma as well.
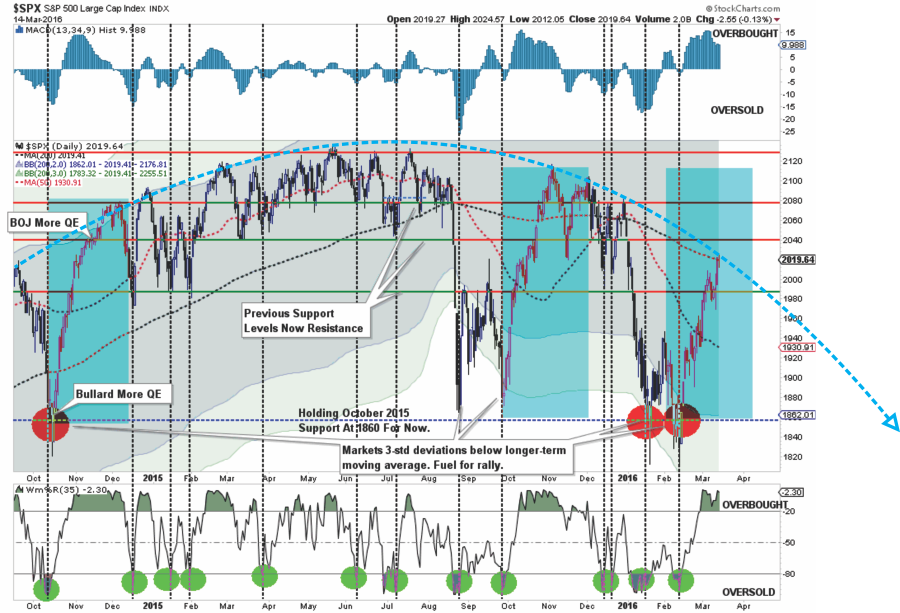
There is a good bit of “stuff” happening in the chart above so let me draw your attention to the more important points.
- The shaded areas represent 2 and 3-standard deviations of price movement from the 125-day moving average. I am using a longer-term moving average here to represent more extreme price extensions of the index. The last 4-times prices were 3-standard deviations below the moving average, the subsequent rallies were very sharp as short positions were forced to cover.
- The top and bottom of the chart show the overbought/sold conditions of the market. The recent rally has responded as expected from recent oversold conditions. With the oversold condition now exhausted, the potential for further upside has been greatly reduced.
- The easiest path for prices continues to be lower as downward resistance continues to be built. The arching dashed blue line shows the change of overall advancing to now declining price trends.
As you will also note above, the rally from the October, 2014 lows coincided with promises of more action from the Fed, “if needed,” and then actual surprise interventions by the BOJ. While the market did manage some advance following the BOJ, that announcement marked the beginning of the end of the bull rally.
Looking back to the bottom in February we see many similarities. There were rumblings from Fed officials about the possibility of “negative rates” followed by last week’s overly ambitious ECB monetary policies.
Did the ECB’s announcement also mark the beginning of the end of the current rally? We will have to wait and see.
THE FED COMETH
Today, the Federal Reserve begins its two-day FOMC confab to discuss monetary policy and will release its decision and quarterly forecasts on Wednesday.
The Fed currently finds itself in a tough spot from a “data dependent” standpoint. Last December, when the Fed Funds rate was increased, the Fed discussed the potential for further rate hikes in 2016 as inflation and employment data strengthened. With that data improving, along with the strong rebound in the financial markets, the Fed runs the risk of losing credibility if they DO NOT hike rates again on Wednesday OR give a very strong indication they will do so at the next meeting.
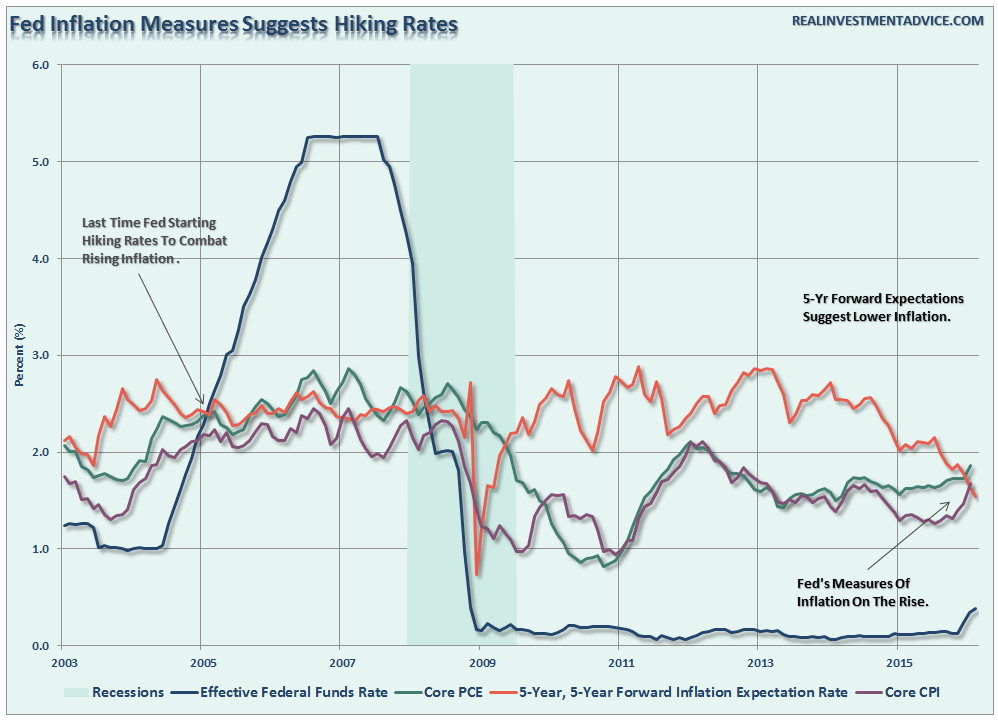

The problem is that in a world where every other Central Bank is loosening monetary policy to support ailing economies and deflationary pressures, the Federal Reserve is the only one tightening policy. Historically speaking, as shown in the chart and table below, tighter monetary policies, particularly this late in an expansionary cycle, has had rather poor outcomes for investors and the economy.

While the Federal Reserve will carefully tailor their statement as to not disrupt the financial markets, I would expect a more “hawkish” stance on policy. My personal take is that the Fed will likely NOT hike rates tomorrow, however, stronger language about further rate hikes this year will be included.
The question is whether the market likes the outlook for stronger economic growth more than a further reduction in monetary accommodation?
MARGIN DEBT SENDS WARNING
One of the things I have addressed in the past is the importance of margin debt.
“What is important to remember is that margin debt ‘fuels’ major market reversions as ‘margin calls’ lead to increased selling pressure to meet required settlements. Unfortunately, since margin debt is a function of portfolio collateral, when the collateral is reduced it requires more forced selling to meet margin requirements. If the market declines further, the problem becomes quickly exacerbated. This is one of the main reasons why the market reversions in 2001 and 2008 were so steep. The danger of high levels of margin debt, as we have currently, is that the right catalyst could ignite a selling panic.
The issue is not whether margin debt will matter, it is just ‘when.’ Unfortunately, for many unwitting investors, when that time comes margin debt will matter ‘a lot.’”
One of the key reasons why the October lows have been defended so vigorously over the last several months is a break below that level will begin to trigger margin calls. Whether or not this can continue until margin debt has mean reverted to more normalized levels is not likely. The chart below points out recent peaks in leverage and the subsequent cycle events in the past.

The reason I suggest that a reversion in margin debt without a full-blown liquidation cycle is unlikely is because the buying power for equities, that came from using margin, has likely reached its limits. As shown in the chart below, courtesy of ValueWalk, households are once again fully invested in financial equities.

While the technical backdrop in the short-term has improved, the longer-term picture still remains extremely worrisome. As shown below, two of the three major monthly sell signals have been triggered. The last will be the crossover of the short-term and long-term monthly averages. As previously, due to the length of time involved in monthly moving averages, by the time this signal crosses the bear market will already be in full swing. However, what is important to note is that all the signs of previous market action during a major market topping process are present.
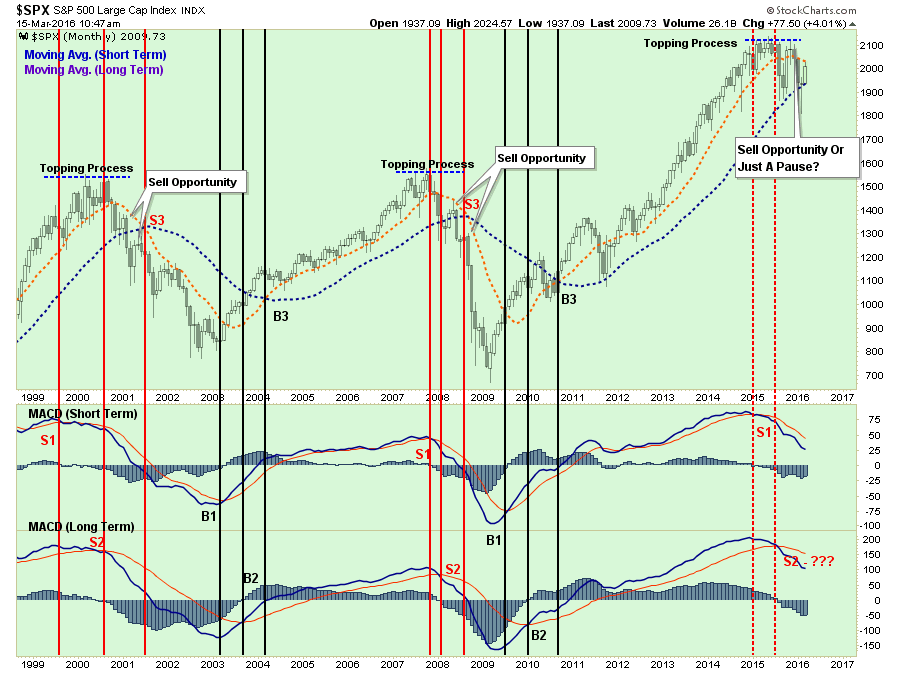
If the markets fail to rise above the short-term moving average and then correct below the long-term, which has currently been acting as support, that will be the beginning of a confirmed bear market cycle.
Conversely, if the market can rally above old highs and, reverse the two lower sell signals, the bull market will be reconfirmed and equity exposure will need to be increased. Of course, at this moment, given the economic and fundamental backdrop, this is a low probability event. Note: I did not say it was IMPOSSIBLE, just IMPROBABLE.
As investors, who have no control over future outcomes, our job is to understand and play within the confines of statistical probabilities rather than making bets on possibilities. The latter is the playground of amateur gamblers who regularly supplies Las Vegas with the operating capital it needs to function.
However, as we approach summer, the seasonal weakness of the markets will likely resurface as the reality of Central Bank interventions are digested and focus once again returns to the real driver of asset prices longer term – profits.
“Everything eventually reverts to the mean.” – Frank Holms
Lance Roberts
Lance Roberts is a Chief Portfolio Strategist/Economist for Clarity Financial. He is also the host of “The Lance Roberts Show” and Chief Editor of the “Real Investment Advice” website and author of “Real Investment Daily” blog and “Real Investment Report“. Follow Lance on Facebook, Twitter, and Linked-In

