
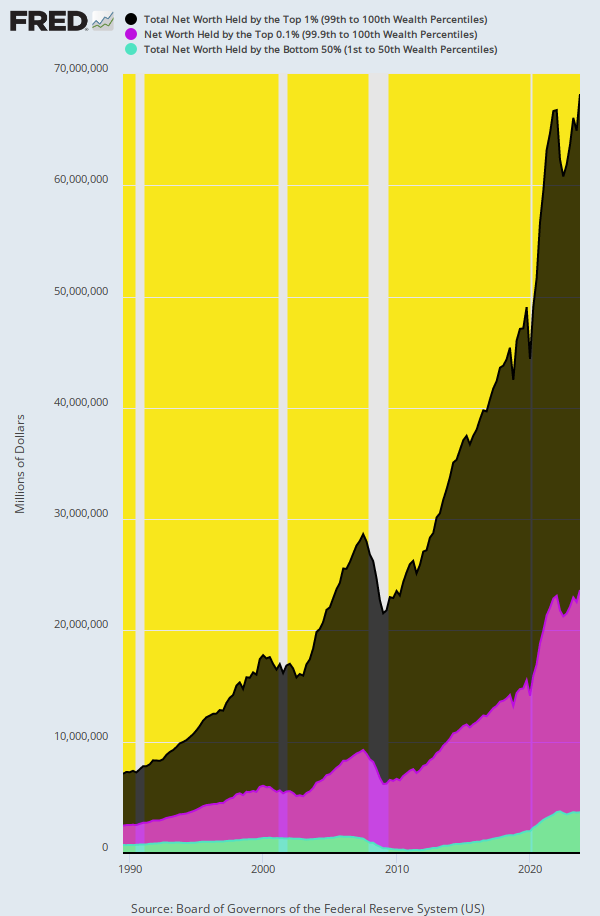
Here is the only noticeable “benefit” from the Fed’s pro-inflation policies since Greenspan’s arrival at the Eccles Building. To wit, these policies have pleasured the tippy top of the economic ladder with massive wealth gains owing to the relentless inflation of financial assets. During the 34 years since 1989, therefore, net worth has increased as follows:
Aggregate Net Worth Gain, Q4 1989 to Q3 2023
- Top 0.1% or 131,000 households (purple area): +$18.2 trillion or 11.4X.
- Top 1.0% or 1.34 million households (black area): +$40.0 trillion or 9.5X.
- Bottom 50% or 65.7 million households (blue area): +$3.7 trillion or 5.1X.
For want of doubt, the corresponding net worth gains on a per household basis are as follows:
Net Worth Gain Per Household, Q4 1989 to Q3 2023
- Top 0.1%: +$139 million each.
- Top 1.0%: + $30 million each.
- Bottom 50%: +$55,000 each.
- Ratio of Top 0.1% Versus Bottom 50%: 2,500X
Aggregate Net Worth By Economic Class, 1989 Q4 to 2023 Q3
Needless to say, the only cohort to experience net wealth gains roughly in line with nominal GDP growth during this 34-year period was the bottom 65.7 million households. Their 5.1X gain was only as tad larger than the 4.9X gain in nominal GDP during the period, which rose from $5.7 trillion to $27.6 trillion.
The veritable eruption of net worth at the tippy-top of the economic ladder at more than double the gain in GDP, therefore, should not be confused with superior virtue, greater investment prowess or any other meritorious factor.

