
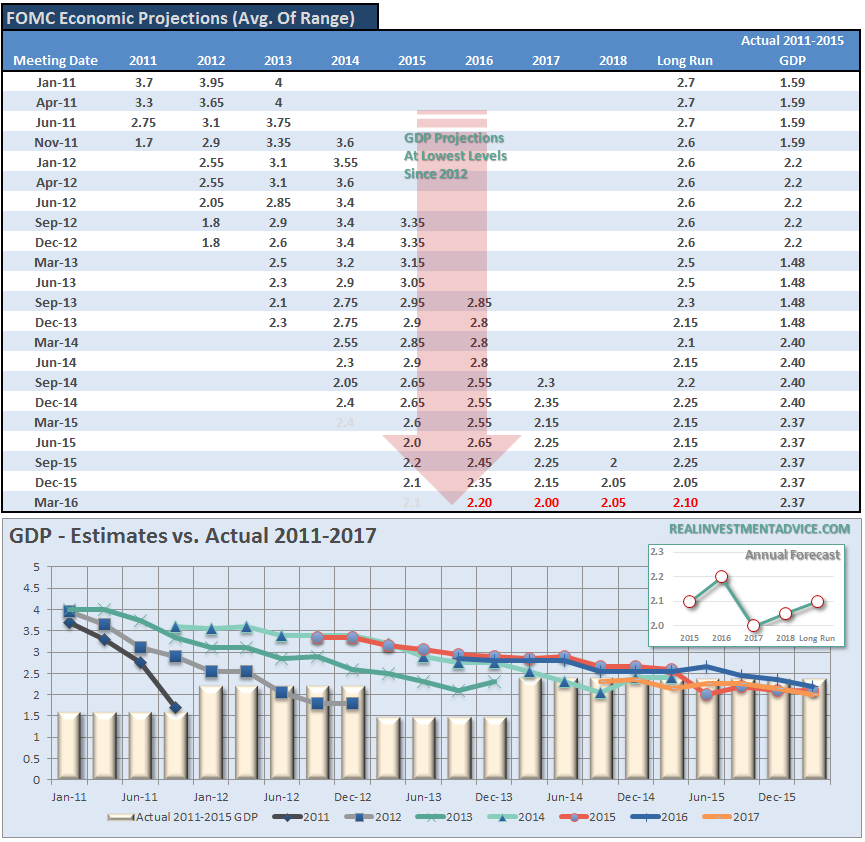
Since the end of the financial crisis, economists, analysts, and the Federal Reserve have continued to predict a return to higher levels of economic growth. As I showed in my discussion of the Fed’s forecasts, these predictions have continued to fall short of reality.
“Besides being absolutely the worst economic forecasters on the planet, the Fed’s real problem is contained within the table and chart below. Despite the rhetoric of stronger employment and economic growth – plunging imports and exports, falling corporate profits, collapsing manufacturing and falling wages all suggest the economy is in no shape to withstand tighter monetary policy at this juncture.”
“Of course, if the Fed openly suggested a ‘recession’ could well be in the cards, the markets would sell off sharply, consumer confidence would drop and a recession would be pulled forward to the present. This is why “what the Fed says” is much less important than what they do.”
Importantly, this point was not lost even on the most bullish minded of individuals, David Rosenberg, who just penned the same for Business Insider:
“I have been in this business for 30 years and have never seen a central bank chief slip the word “uncertainty” into the headline.
Not just that, but she invoked the term no fewer than 10 times to describe the domestic and global macro and market backdrop — this even as we pass seven years since the worst point of the Great Recession and seven years into the most radical easing of monetary policy in recorded history.
It begs the question: what has gone wrong?”
However, the issue is much greater than just what has gone wrong in recent months. Since 1999, the annual real economic growth rate has run at 1.86%, which is the lowest growth rate in history including the ‘Great Depression.’ I have broken down economic growth into major cycles for clarity.

While economists, politicians, and analysts point to current data points and primarily coincident indicators to create a “bullish spin” for the investing public, the underlying deterioration in economic prosperity is a much more important long-term concern. The question that we should be asking is “why is this happening?”
From 1950-1980 nominal GDP grew at an annualized rate of 7.55%. This was accomplished with a total credit market debt to GDP ratio of less 150%. The CRITICAL factor to note is that economic growth was trending higher during this span going from roughly 5% to a peak of nearly 15%. There were a couple of reasons for this. First, lower levels of debt allowed for personal savings to remain robust which fueled productive investment in the economy. Secondly, the economy was focused primarily on production and manufacturing which has a high multiplier effect on the economy. This feat of growth also occurred in the face of steadily rising interest rates which peaked with economic expansion in 1980.

However, beginning in 1980 the shift of the economic makeup from a manufacturing and production based economy to a service and finance economy, where there is a low economic multiplier, is partially responsible for this transformation. The decline in economic output was further exacerbated by increased productivity through technological advances and outsourcing of manufacturing which plagued the economy with steadily decreasing wages. Unlike the steadily growing economic environment prior to 1980; the post-1980 economy has experienced a steady decline. Therefore, a statement that the economy has had an average growth of X% since 1980 is grossly misleading. The trend of the growth is far more important, and telling, than the average growth rate over time.
This decline in economic growth over the past 30 years has kept the average American struggling to maintain their standard of living. As their wages declined, they were forced to turn to credit to fill the gap in maintaining their current standard of living. This demand for credit became the new breeding ground for the financed based economy. Easier credit terms, lower interest rates, easier lending standards and less regulation fueled the continued consumption boom. By the end of 2007, the household debt outstanding had surged to 140% of GDP. It was only a function of time until the collapse in the “house built of credit cards” occurred.

This is why the economic prosperity of the last 30 years has been a fantasy. While America, at least on the surface, was the envy of the world for its apparent success and prosperity; the underlying cancer of debt expansion and declining wages was eating away at the core. The only way to maintain the “standard of living” that American’s were told they “deserved,” was to utilize ever-increasing levels of debt. The now deregulated financial institutions were only too happy to provide that “credit” as it was a financial windfall of mass proportions.

The massive indulgence in debt, what the Austrians refer to as a “credit induced boom,” has likely reached its inevitable conclusion. The unsustainable credit-sourced boom, which led to artificially stimulated borrowing, has continued to seek out ever diminishing investment opportunities. Ultimately these diminished investment opportunities repeatedly lead to widespread mal-investments. Not surprisingly, we clearly saw it play out “real-time” in everything from subprime mortgages to derivative instruments which were only for the purpose of milking the system of every potential penny regardless of the apparent underlying risk. We see it playing out again in the “chase for yield” in everything from junk bonds to equities. Not surprisingly, the end result will not be any different.

When credit creation can no longer be sustained, the process of clearing the excesses must be completed before the cycle can resume. It is only then, and must be allowed to happen, can resources be reallocated back towards more efficient uses. This is why all the efforts of Keynesian policies to stimulate growth in the economy have ultimately failed. Those fiscal and monetary policies, from TARP and QE to tax cuts, only delay the clearing process. Ultimately, that delay only potentially worsens the inevitable clearing process.
The clearing process is going to be very substantial. The economy currently requires nearly $3.00 of debt to create $1 of real (inflation adjusted) economic growth. A reversion to a structurally manageable level of debt* would require in excess of $35 Trillion in debt reduction. The economic drag from such a reduction would be dramatic while the clearing process occurs.

*Structural Debt Level – Estimated trend of debt growth in a normalized economic environment which would be supportive of economic growth levels of 150% of debt-to-GDP.
Rosenberg is right. It is likely that “something has gone wrong” for the Federal Reserve as the efficacy to pull-forward future consumption through monetary interventions has been reached. Despite ongoing hopes of “higher growth rates” in the future, it is likely that such will not be the case until the debt overhang is eventually cleared.
Does this mean that all is doomed? Of course, not. However, we will likely remain constrained in the current cycle of “spurt and sputter” growth cycle we have witnessed since 2009. Such will be marked by continued volatile equity market returns and a stagflationary environment as wages remain suppressed while costs of living rise. Ultimately, it is the process of clearing the excess debt levels that will allow personal savings rates to return to levels that can promote productive investment, production, and consumption.
The end game of three decades of excess is upon us, and we can’t deny the weight of the debt imbalances that are currently in play. The medicine that the current administration is prescribing is a treatment for the common cold; in this case a normal business cycle recession. The problem is that the patient is suffering from a “debt cancer,” and until the proper treatment is prescribed and implemented; the patient will most likely continue to suffer.
Has something gone wrong? Absolutely.
Lance Roberts

Lance Roberts is a Chief Portfolio Strategist/Economist for Clarity Financial. He is also the host of “The Lance Roberts Show” and Chief Editor of the “Real Investment Advice” website and author of “Real Investment Daily” blog and “Real Investment Report“. Follow Lance on Facebook, Twitter, and Linked-In

