Orthodox economic theory assigns recession to some exogenous “shock.” Without it, an economy is supposed to grow indefinitely along its trend or potential baseline so long as NAIRU (non-accelerating inflation rate of unemployment) is maintained. As you can imagine, economists and policymakers spend most of their time on that latter part which is one reason, though more so ideology, that they ignore the questionability of the former assumption. In very simple terms, any positive number and a great many still negative are taken as evidence of “growth” precluding recession. Absent a “shock”, there are no other orthodox options.
Setting aside all objections to NAIRU, of which there are many starting with massive imprecision, there is some good logic to the textbook recession case. In very general terms, it suggests that recessions are just temporary deviations from the potential baseline brought about by whatever “shock.” That means there should be symmetry and proportionality in the recovery for its preceding recession. The conspicuous absence of both in this “cycle” already proposes something else perhaps beyond recession now into 2016.
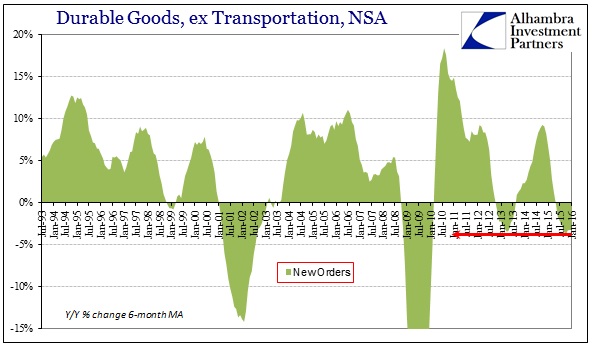
The update for durable goods orders and shipments for February (released last week) showed the first monthly year-over-year gain in about a year. Both durable goods (ex transportation) and non-defense capital goods (ex aircraft) were slightly higher for the first time going back 12 and 13 months, respectively. Considering monthly variation or even the 29th day in February, the positive numbers may only suggest that the same trend is in place that struck in the latter half of 2014. In other words, because February 2015 was a contraction a small rise off that level in February 2016 does not immediately propose “it’s over.” In fact, as you can see below, the latest update only continues what might be an even worse case than recession.
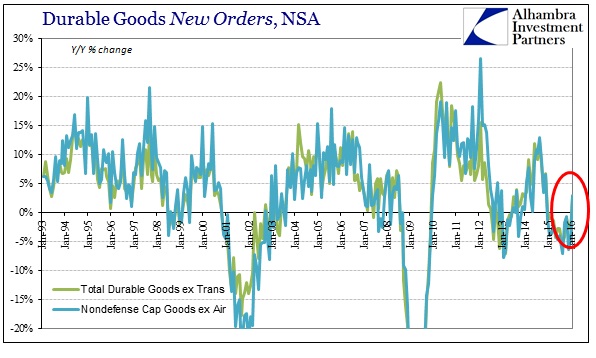
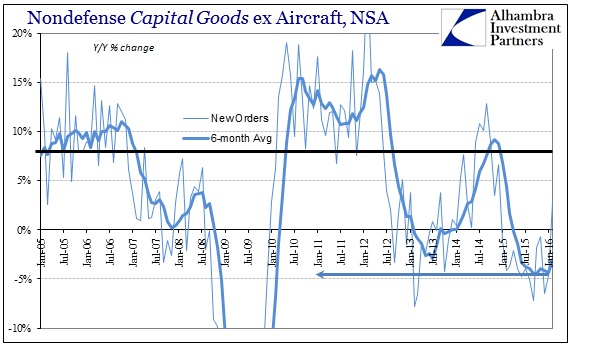
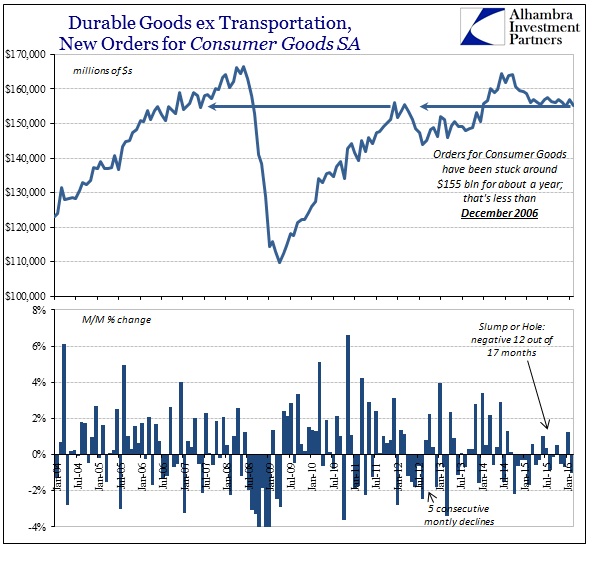
At about $155 billion, durable goods orders (for consumer goods) have been stuck for about a year at a level first seen in late 2006 – almost a decade ago. Therefore, unless the positive number is enormous, it isn’t anything different. Both parts of that deficiency are relevant; stuck for a year indicating something more like “cyclical” and at something like 2006 levels suggesting structural. Put together, recession may not be the indication, leaving economists and their search for shock intact, but that isn’t actually important.
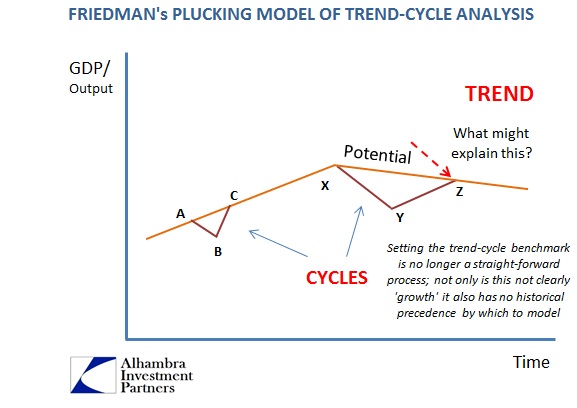
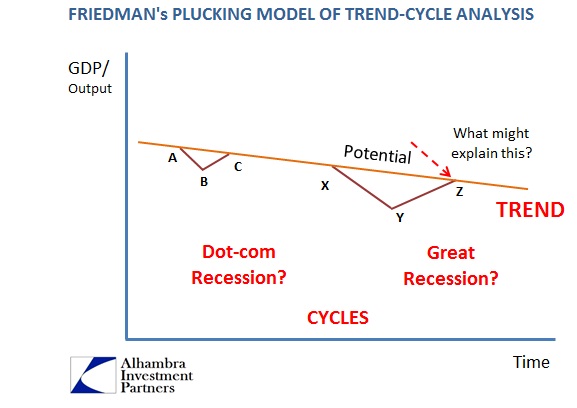
Using Milton Friedman’s plucking model version, we can tell a lot about current circumstances by how far it has deviated from expectations (natural rate hypothesis isn’t all that much different).
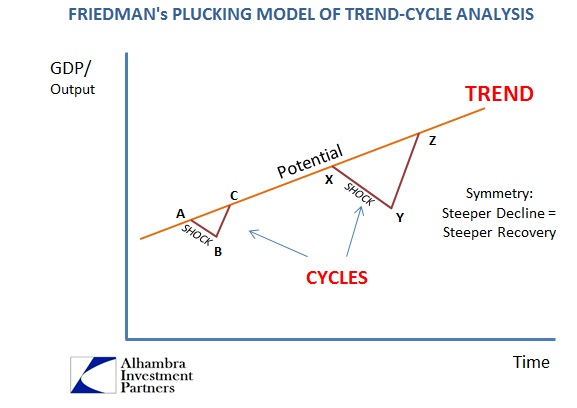
Again, the scale of the recovery is governed by the scale of the recession so that the full cycle is but a temporary aberration from the established, positive trend. We already know that has failed for the Great Recession as at most there was some recovery proportionality but only in the earliest months and not surviving past the events in 2010 (thus QE2).
This is not just theoretical posturing, as we can observe this breakage in any number of actual economic accounts – including durable goods.
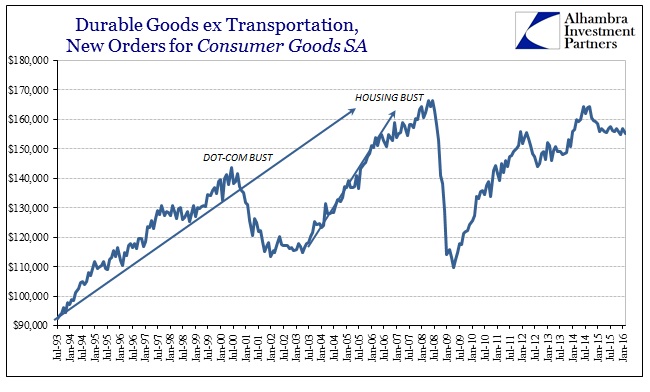
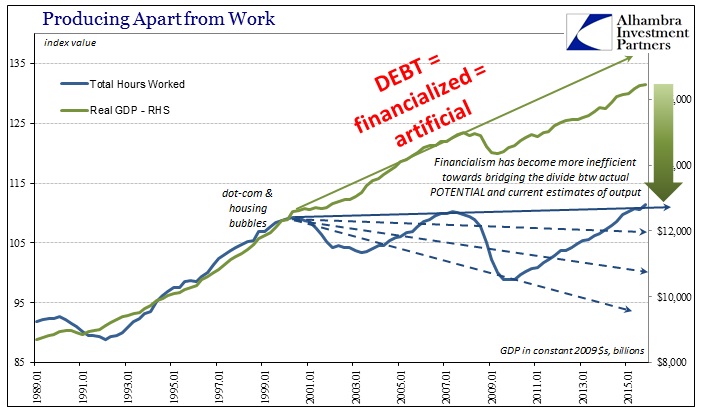
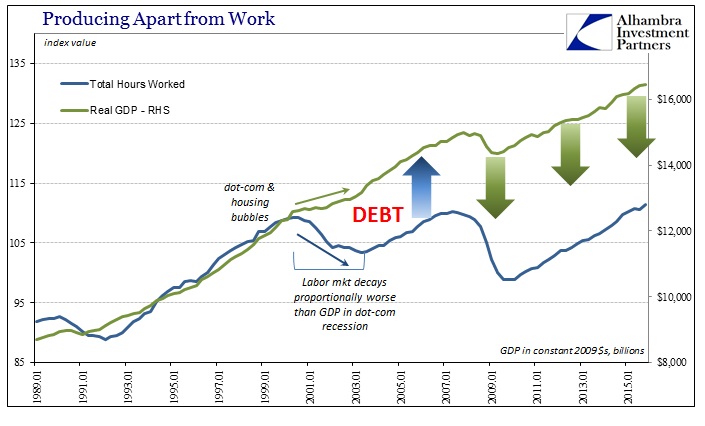
After the dot-com recession, durable goods growth began to resemble its prior trend established in the 1990’s. That lasted only until the housing bust and tellingly has never been close to the same since. It recommends three distinct stages that undermine the idea of unbroken trend/potential. We know the middle stage was dominated by the asset inflation and credit growth through mortgage debt (especially houses as ATM’s) so it stands to reason that given the ultimate shortfall in the economy and consumer spending despite the huge supplementation of credit growth that the actual economic potential might have been something else starting with the 2000’s. In other words, had the true economic baseline been constant from the 1990’s forward then the massive expansion in mortgage and consumer debt should have brought about not re-establishment of that trend but advancing so far above it (and perhaps seriously threatening policy NAIRU).
That leaves the surge in debt in the middle 2000’s as obvious “filler” for what increasingly looks to be an inflection in the true trend line. The housing bust changed the nature of this kind of financialism (eurodollars and all that) which no longer interacts in the real economy as efficiently. There is more debt but more so narrowly channeled (by the bond market) into corporate debt and therefore narrow recirculation via either sustaining companies that likely should have ended (or never started) long ago (junk bonds and leveraged loans), or into the hands of only stockholders through debt-funded buybacks and dividends. The effect on the economy is thus a broken trend; especially as compared to the pre-2007 function.
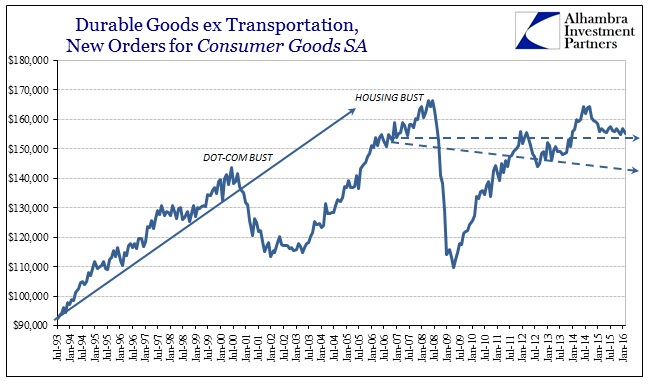
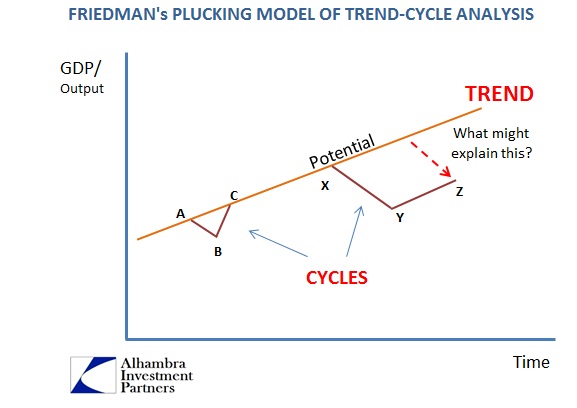
In this circumstance, it is not recession per se that is offered, but overall reversion back to whatever the true trend line potential might be. The problem is figuring out how damaged organic economic growth potential has become, and unfortunately other indications suggest this (consumer spending) is only one part of that equation. If there is indeed a broken trend, it isn’t obvious where the break occurred. The fact of the debt conditions in the middle 2000’s might suggest the housing bust, but there are many indications that show it far earlier.
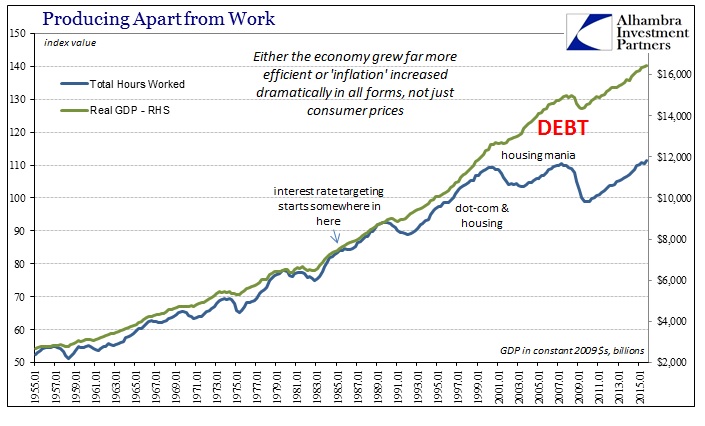
It was in the 1990’s that labor growth began to deviate somewhat from total output (in this case measured as real GDP). This disparity turned huge in the 2000’s, which can only mean asset inflation (escaping NAIRU since “inflation” in that view is limited to consumer prices) funneled through debt. The labor market view of the economy shows that eroded baseline, the downward inflection in potential whereas GDP (output) was almost unbothered by any of those events. Despite the “jobless” recovery 2001-03, there was enormous mortgage volume to make up only some of the difference (showed in both durable goods and GDP growth that was slower than prior history).
The deficiency in output in whatever form after the Great Recession is the difference in debt redistribution. Consumers are no longer the primary “beneficiary” and those that are populate that extremely narrow channel. The BLS estimates total hours worked in 2016, including the run-up of the “best labor market in decades” over the past two years, are barely above the level of labor utilization and output seen in 2000! That can only mean a shrunken economy, which again suggests this downward baseline. It was the unevenness of the financialism that obscured it before (as artificial growth) and then after (as suddenly and mysteriously “recovery” without recovery).
This latter stage of trend breakage is then just a reduction in artificiality which seems to at least predate the worst of the housing bubble, though we can’t know for sure how far back it goes (my personal belief is, unsurprisingly, somewhere around 1995). What that means for the current “cycle” is that output cannot stray too far from actual potential since there is no longer a broad enough channel for further artificiality. That includes the broken eurodollar system which precludes the more traditional and widespread debt expansion via banking (rather than bonds).
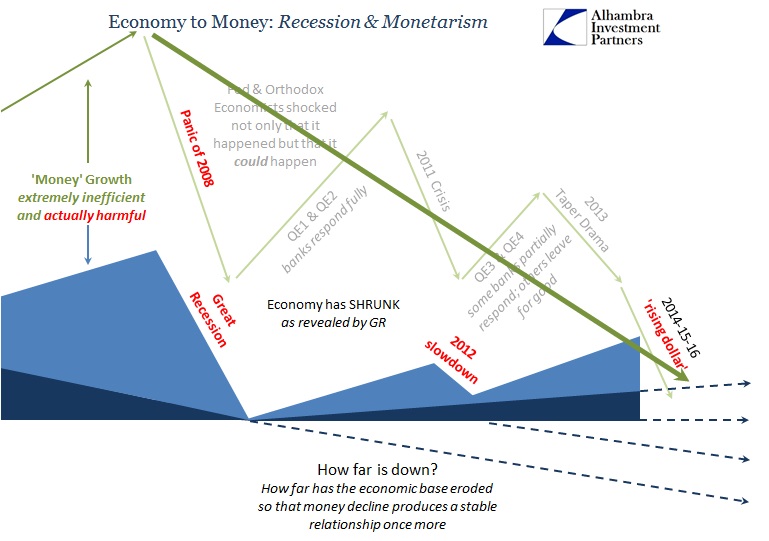
What, then, is the true baseline of economic potential? It’s an as-yet unanswerable question. What durable goods as well as labor and other indications advise is that we may be in process of finding out. They already suggest at least one inflection due to the differences in artificiality, but there are deeper factors to also consider. It might not look like recession because it really isn’t; and that is not good news at all. In other words, the economy mimics some of the worst aspects of recession but without its temporary nature. It is a slowdown or even contraction that won’t stop slowing (or contracting). We have already seen this structural adjustment or reversion process playing out overseas, China and Brazil most visibly, and it doesn’t even exclude the eventual onset of actual recession within it.
That may have been the Great Recession in its true form – a recession that formed that was indeed a temporary deviation from trend, only that the trend was not the assumed growth baseline but the structural reversion that had been revealed by at least the housing bust if not further back. That’s the worst of the worst case, where the baseline continues to be lower but with still recession “cycles” cropping up and conforming to it. In 2008, there was already the slowdown that might have turned to recession cycle by the financial “shock.” The end of the Great Recession from this view was actually proportional, but only proportional to that diminishing potential/trend.
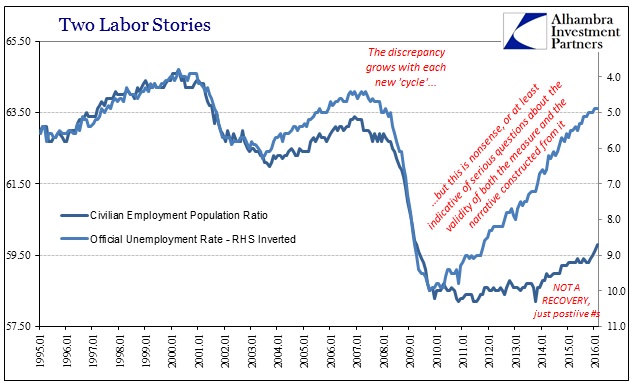
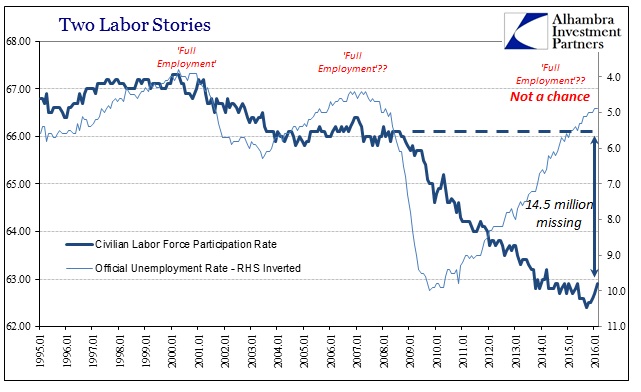
The result would be something like what we see in labor participation – continually ratcheting lower after each.
The effects on overall output, such as durable goods orders, come out as the ability of financialism to counteract the shrinking (to say nothing of causing it in the first place). It wasn’t enough in the biggest bubble in history, so we shouldn’t be too surprised at the continual lack of economic growth since. In fact, judging by the GDP version of output the economy seems to have held up surprisingly well under these circumstances. And that may not be good news, either, as it may indicate only more reversion to come – especially if the labor statistics are highly overstated.