
“
In this past weekend’s commentary, I discussed the failure of the market to hold its breakout above 2100 last week.
“The short-term outlook suggests more vulnerability to selling. Importantly, the markets must hold support at 2080, the short-term moving average, or 2040 which is the recent bottoms of what currently appears to be a potential topping process.
The failure of the markets this week to break, and hold, above 2100 keeps portfolio allocations at current levels. As shown below, the downtrend resistance, on a weekly basis, also coincides with 2040 reinforcing the importance of that support level. Stop loss levels are current set at 2020, and portfolio hedges will be added with a subsequent break of 2000.”

The sell-off that started on Friday and continued through Monday also coincided with a sharp rise in market volatility. While the pop in volatility has been more of the “norm” in the markets since last May, it is the rising trend of volatility that concerns me.
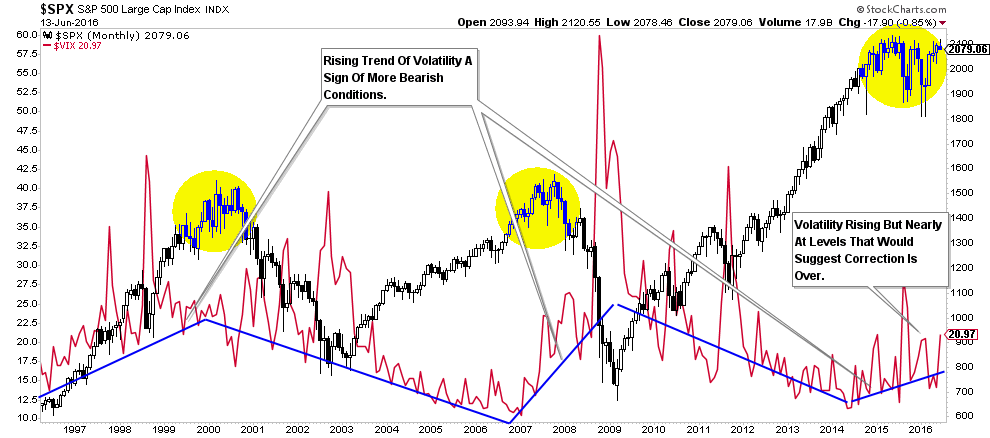
As shown above, when volatility TRENDS higher, it has generally been an “early warning” of a market in the midst of a topping process.
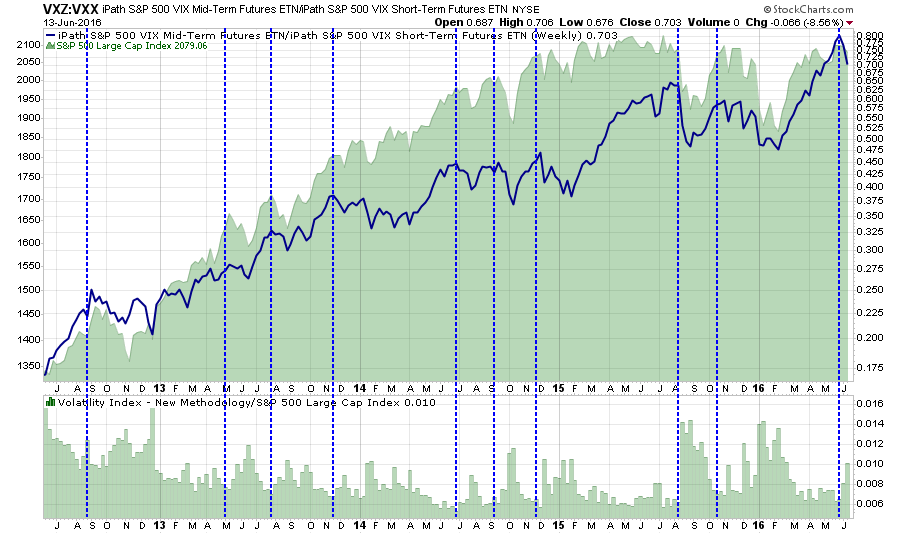
The chart below is a little different look at volatility by measuring the ratio between the short and mid-term volatility futures. As shown, when the VIX has turned up, coincidently pushing the short/mid-term volatility ratio down, it has generally coincided with a correction in the markets. Given the recent ramp up in the volatility ratio, the current correction likely has further to go.
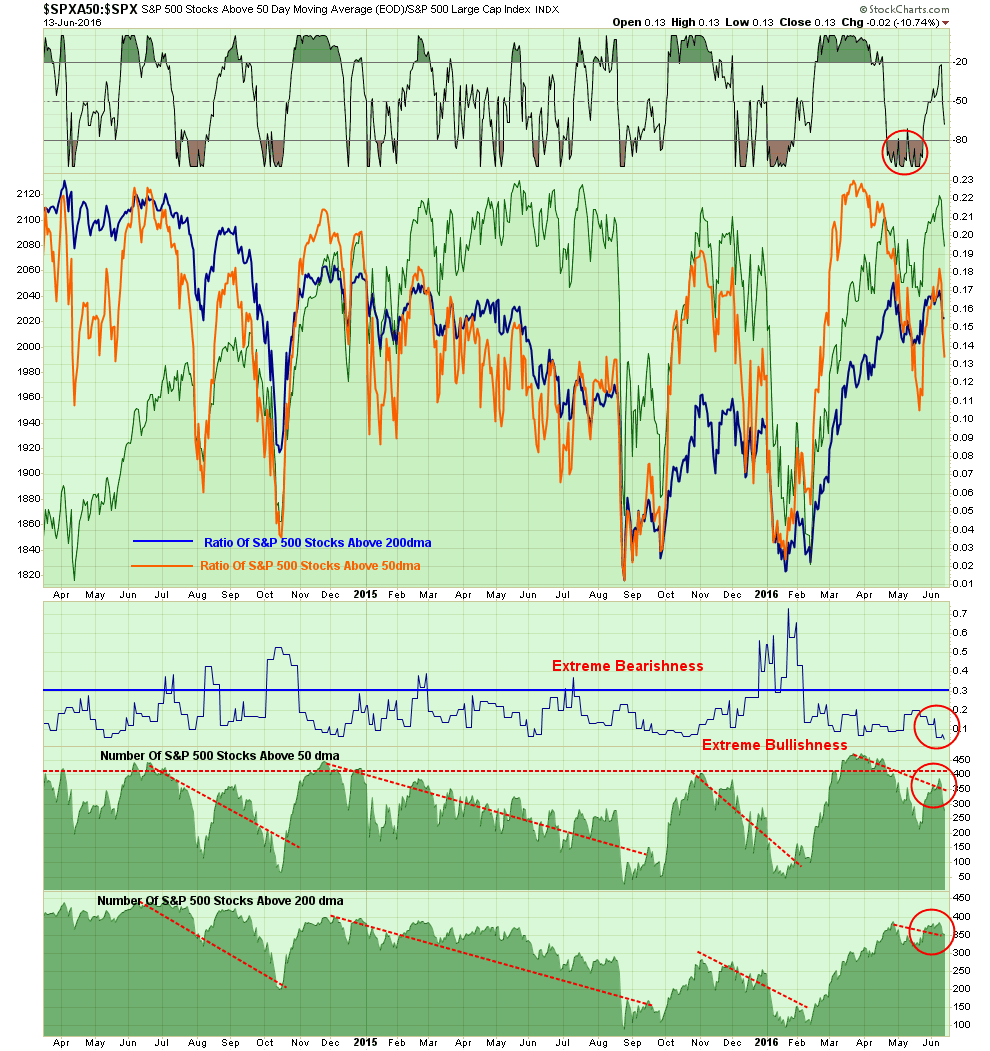
Lastly, as shown in the next chart, the number of stocks above their respective 50 and 200 day moving average have started to decline with the ratio of bullish/bearish sentiment at bullish extremes. Historically, the combination of these two measures of “bullish bias” have led to a period of consolidation or correction in the markets.
As I stated last week (subscribe for free e-delivery):
“With the markets overbought, underlying fundamentals and economics deteriorating, and profits still weak, some portfolio actions should be taken to reduce, but not yet eliminate, overall risk.
- Tighten up stop-loss levels to current support levels for each position.
- Hedge portfolios against major market declines.
- Take profits in positions that have been big winners
- Sell laggards and losers
- Raise cash and rebalance portfolios to target weightings.”
This brings me to the “rant of the day.”
The Low-Interest Rate Fallacy
“While valuations may be high compared to historical averages, low interest rates justify those valuations.” – Often Repeated On Twitter.
The basic premise of the interest rate / valuation argument has its roots in the “Fed Model” as promoted by Alan Greenspan during his tenure as Federal Reserve Chairman.
The Fed Model basically states that when the earnings yield on stocks (earnings divided by price) is higher than the Treasury yield; you should be invested in stocks and vice-versa. In other words, disregard valuations and buy yield.
Let me warn you now this will not end well.
The problem here is two-fold. First, you receive the income from owning a Treasury bond whereas there is no tangible return from an earnings yield. Therefore, if I own a Treasury with a 5% yield and a stock with a 8% earnings yield, if the price of both assets do not move for one year – my net return on the bond is 5% and on the stock, it is 0%.
Which one had the better return?
Yet, analysts keep trotting out this broken model to entice investors to chase an asset class with substantially higher volatility risk and lower returns.
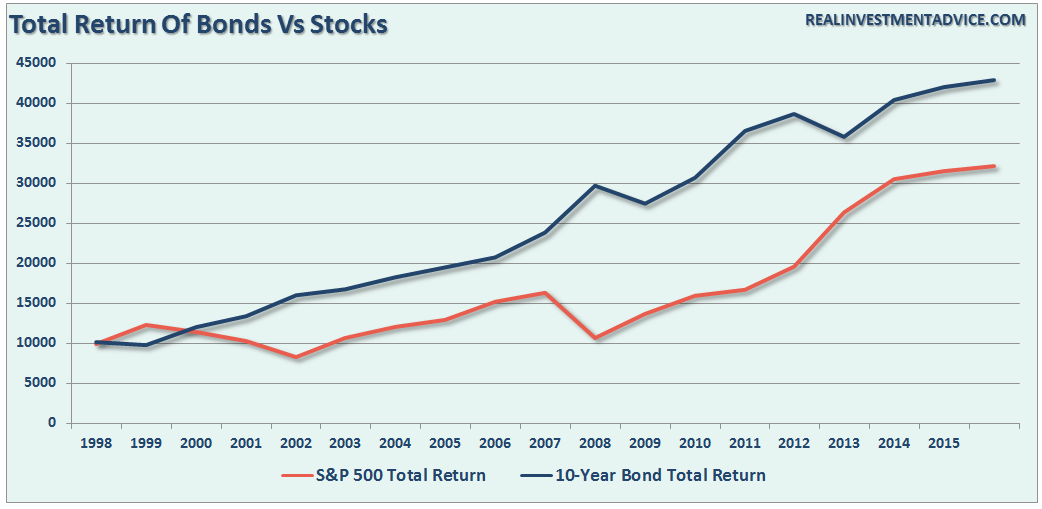
It hasn’t been just since the turn of the century either. An analysis of previous history alone proves this is a very flawed concept and one that should be sent out to pasture sooner rather than later. During the 50’s and 60’s the model actually worked pretty well as economic growth was strengthening.
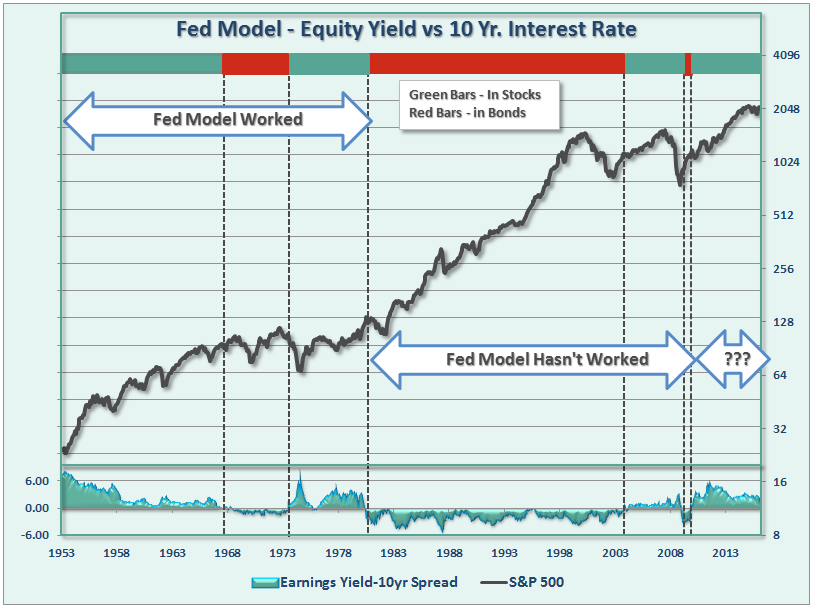
However, beginning in 1980, as Reagan and Volker set out to break the back of high interest rates, the model no longer functioned. During the biggest bull market in the history of the markets, you would have sat idly by in treasuries and watched stocks skyrocket higher.
However, not to despair, the Fed Model did turn in 2003 and signaled a move from bonds back into stocks. Unfortunately, the model also got you out just after you lost a large chunk of your principal after the crash of the markets in 2008.
Currently, the model once again seems to be working. However, is the recent decline in interest rates sending a warning signal we should be paying attention to. The chart below takes the interest rate argument from a little angle. I have capped interest rates from their “low point” of each interest rate cycle to the next “high point” and then compared it to the S&P 500 index. (The vertical dashed lines mark the peaks in the S&P 500 Index)
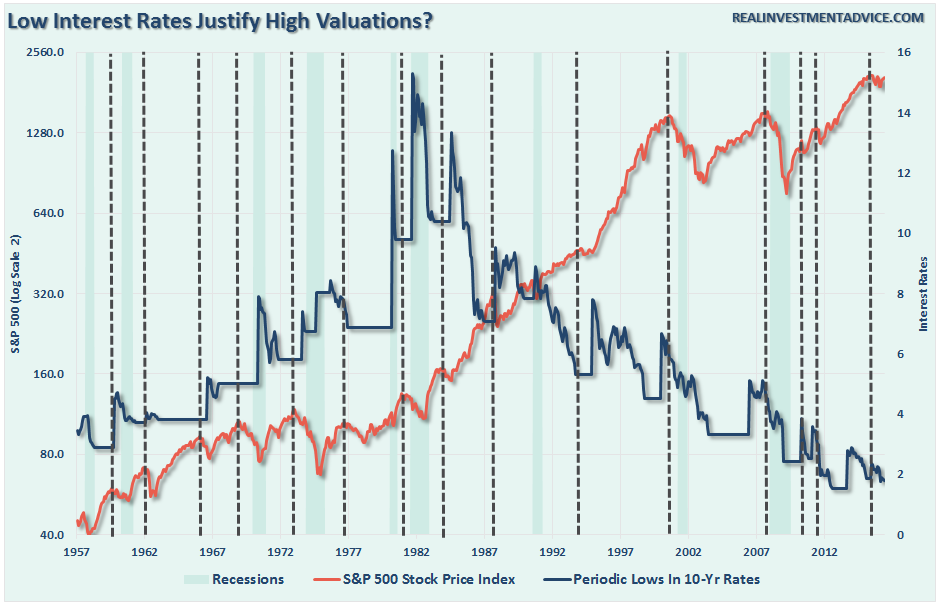
What we find is that in the majority of cases, the market tends to peak between the low point interest rates for each cycle and the next high point. In other words, a period of steadily rising interest rates is not conducive to higher equity prices.
But let’s get back to interest rates justifying higher valuations? The chart below shows the 10-year treasury rate as compared to stock market valuations going back to 1900.
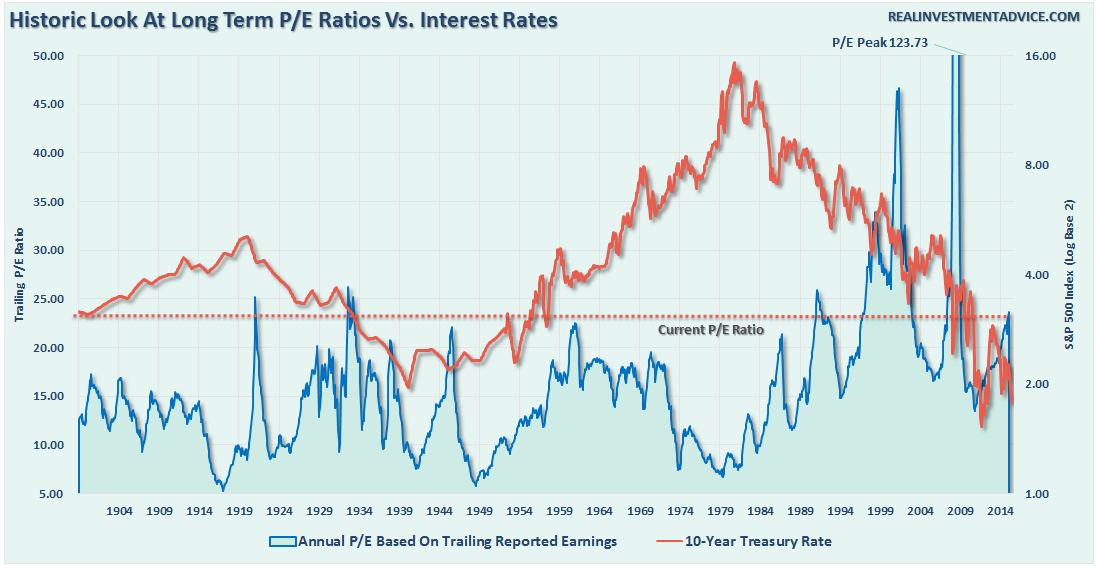
What we find is the last time interest rate fell to historically low levels was during the “Great Depression.” The relationship can be more clearly seen by comparing the chart above to that of valuations versus the S&P 500 index below.
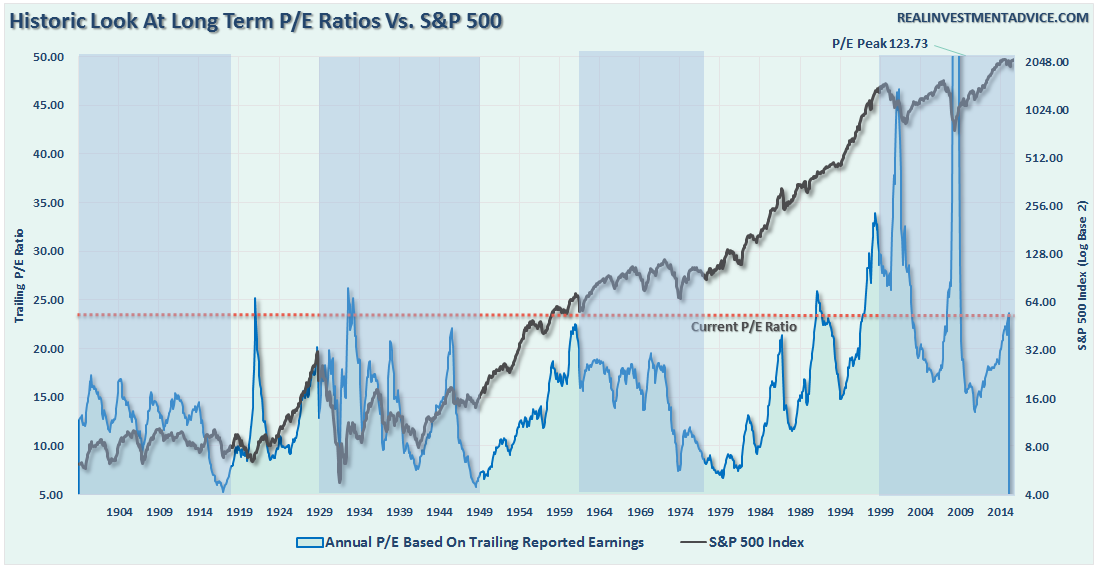
Here is the important point. There is much to debate about the current level of interest rates and future stock market returns. However, what is clear is that the 30-year decline in rates did not mitigate two extremely nasty bear markets since 1998 just as falling rates did not mitigate the crash in 1929 and the subsequent depression.
What is truly the best indicator of future returns is simply the valuation investors pay today for the earnings and revenue generated tomorrow.
As with anything in life – half of the key to long-term success is timing. Right now, with virtually all of the economic indicators weakening and pointed towards recession, a lack of support by the Fed in terms of stimulus, and a vast array of varied risks from negative rates and to the deterioration of technical strength in the market; the timing could not be worse for long-term investors.
Do low interest rates justify high valuations? History suggests not, and it is likely a trap which will once again leave investors with the four “B’s” following the next recession – Beaten, Battered, Bruised and Broke.
“Never forget, things change” – Lowell Miller
Lance Roberts
Lance Roberts is a Chief Portfolio Strategist/Economist for Clarity Financial. He is also the host of “The Lance Roberts Show” and Chief Editor of the “Real Investment Advice” website and author of “Real Investment Daily” blog and “Real Investment Report“. Follow Lance on Facebook, Twitter, and Linked-In

