
The rationale for the recent runup in Treasury yields is that that the economy will strengthen under El Presidente Cabeza Grande Trump. Supposedly El Presidente’s wise and stimulative policies will make the economy grow 5%. Hey, if El Presidente Cabeza Grande says it, it must be true! And the Wall Street pundits, with their infinitely perspicacious analytical capability have wisely concluded that this means that inflation will rise.
Never mind that we’ve already had massive asset inflation. That doesn’t count in their worldview.
So we’re going to have more “inflation.” And bond yields will magically rise, just because that’s what they always do when there’s more inflation.
I have a simpler explanation. It’s called supply and demand. I have been tracking the data on actual supply of Treasuries, and demand for Treasuries, both at the Treasury Auctions and in the secondary market every month for nearly 15 years. As a result I saw that last July was an inflection point.
The apparent bubble in Treasury prices saw yields on the 10 Year Treasury drop below 1.5% twice. Once was in 2012, and the second time was last July. Right around that second touch of the sub 1.5 area, virtually the entire Wall Street chattering class had concluded that yields must now be headed to 1%, and ultimately ZERO! Or even sub Zero, like the craziness in Europe.
They were wrong.
Prior to July 2016, the net new monthly supply of new Treasuries had been steadily declining. Demand was also declining. But supply was falling faster up until that point.
Then supply stopped falling. It stabilized, and has even risen a bit as the Federal deficit began, ever so slightly, to grow each month. The US Treasury was simultaneously working to build a war chest of cash for the next civil war over the debt limit. They had a goal of $500 billion. That meant boosting net new borrowing each month before the debt ceiling was to be reimposed this coming March.
Simultaneously, the US economy was producing slightly less tax revenue than the wise and powerful government and Wall Street economists had forecast. So in July, we no longer had supply falling faster faster than demand. At that time we still had falling demand, but supply was no longer falling faster. In fact, it was no longer falling at all. It had begun to increase.
The trend of declining demand isn’t new. It has been under way since 2009. I see no reason to expect that to change any time soon. So the question becomes whether this 6 month trend of increasing supply is only a flash in the pan that will soon revert back to the norm of the prior 7 years of falling supply?
Not if El Presidente Cabeza Grande has anything to do with it. His entire program is based on increased spending on things like infrastructure and “rebuilding” our “weak” military.
I don’t need to remind you what Mr. Stockman thinks of that idea. But the Republican Congress is likely go along with it. They may not love the idea of building new roads, bridges, schools, and hospitals where, God forbid, Democrats may live. But they love military spending. Most military bases are, after all, in Republican districts.
Not that politics would ever interfere with these momentous decisions on economic policy, but I do believe that El Presidente Cabeza Grande holds all the cards here. He’ll get what he wants initially.
That means bigger deficits and more Treasury supply. All in the face of a long term trend of a declining world wide appetite for Treasuries. When you strip out all the nonsense and get down to the basics, the reasons for the recent rise in yields become much more obvious.
Below is just a tiny portion of the data I look at each month in the Wall Street Examiner Pro Trader Treasury Report to help gain an understanding of the trend of the Treasury market. It’s important not just for the bond market, but for stocks as well. If Treasury supply increases, that’s a problem for the stock market because it absorbs money that potentially would have flowed into the stock market.
Treasury Auction Supply and Demand
Treasury Bills
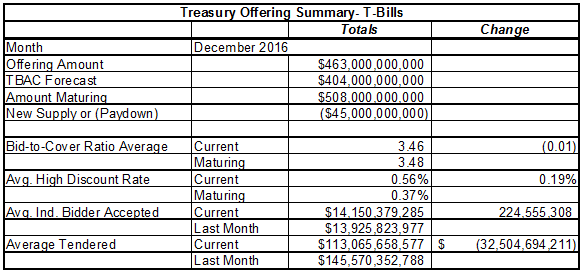
The Treasury paid down $45 billion in outstanding bill supply in December. That partly reversed a massive $110 billion of net new issuance in November. When the Treasury issues net new supply it takes cash out of the market because dealers and investors need to raise cash to buy the new securities. When the Treasury pays down debt, it puts cash back into the accounts of the erstwhile holders of the maturing paper.
That tends to boost the market. When that cash is returned to the former holders of the paper, they look for a place to redeploy the cash. They will typically bid more aggressively to purchase whatever paper is available. That tends to push money market rates down. It may also spill into bond yields, and even contribute to a rally in stock prices.
That did not happen last month. T-bill rates continued to rise, while longer term paper and stocks held steady. The fact that short term rates continued to rise indicates that there’s a problem on the demand side.
It wasn’t about the market anticipating a Fed Funds rate increase. It was about a reduction of money market liquidity, as European banks are under increasing pressure to raise cash. I cover that saga in the European banking update in the Macroliquidity service.
The TBAC is a committee of Primary Dealers tasked by the Fed to provide it with a quarterly forecast of how much Treasury debt will be needed to cover the deficit for the current and next quarters. Offerings totaled $48 billion more than the TBAC. That’s the second straight month where bill supply was well above forecast. Most of the difference was in 4 week bills, but there were also increases in 13 and 26 week bills.
The average total bid per auction fell sharply from the November average. That was mostly because the auctions were smaller in size than the November auctions, in spite of the fact that they were above forecast. The November offerings were gargantuan. December’s were big, but not gargantuan. Everything is relative.
But the bottom line is that rates rose. There wasn’t enough demand to keep that from happening.
The indirect bid, which largely represents foreign central banks, along with others bidding through Primary Dealers, rose slightly. But demand was much weaker among dealers and direct bidders. The result was that the average discount rate rose by 10 basis points from November, and by 19 basis points from the average of the paper being rolled over. There can be no doubt. The money markets are tightening.
Coupon Offerings
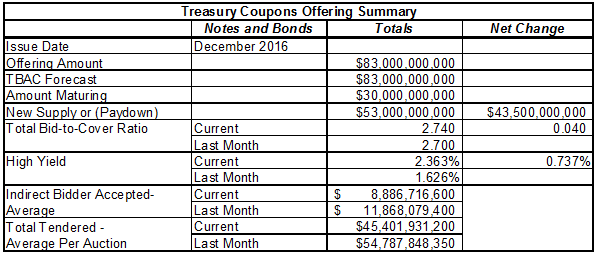
The Treasury issued $53 billion in net new notes and bonds during December. That was exactly as the TBAC had forecast. It was a lot more than the $9.5 billion in net new supply issued in November.
In theory, what should happen when supply increases? Prices should go down and yields should go up. In practice, that’s exactly what happened, as the average high yield per auction rose by nearly 74 basis points. It didn’t help that the total bid per auction fell sharply.
Increasing supply and declining demand. Now there’s a winning combination!
Again, I think this relates to European bank selling. The stress will only grow from here. 12/4/16 Tonight, the Italian government nationalized the collapsing Monte di Paschi di Sienna Bank, the oldest continuously operated bank in the world, and one of Italy’s largest. I used their ATMs while in Italy last spring. It will be interesting to see if I can get cash from them this year.
The indirect bid consists of third parties bidding through Primary Dealers. It is somewhat indicative of foreign central bank demand as most of the FCBs typically bid through the dealers. It also weakened versus November. So the weakness in overall demand is coming not only from the private sector, but from foreign central banks as well.
This isn’t new. It’s part of a trend of weaker demand for Treasuries that has persisted for several years. So why were yields continuing to rally until last July? Because new supply was falling even faster than demand. The trend of falling supply appeared to end in the middle of 2016. For the past 6 months, demand has fallen faster than supply. There’s no basis to expect that to change any time soon.
This report is excerpted from Lee Adler’s Wall Street Examiner Pro Trader Monthly Treasury Supply and Demand Report.
Lee first reported in 2002 that Fed actions were driving US stock prices. He has tracked and reported on that relationship for his subscribers ever since. Try Lee’s groundbreaking reports on the Fed and the Monetary forces that drive market trends for 3 months risk free, with a full money back guarantee. Be in the know. Subscribe now, risk free!

