
Tomorrow night, the President Obama will deliver his final annual “State Of The Union” address. Just recently, the President gave a preview of his upcoming speech from the White House.
While Obama promises to frame his speech around the “things we need to do over the years to come,” he will use his bully pulpit to focus on his record of achievements (especially those related to the environment and trade) and push for further restrictions on gun ownership.
With the 2016 Presidential Election fast approaching, this is one of the final chances the White House will have to give a boost to the Democratic voters following the beating they took in the 2012 mid-term elections. The message sent then, even by traditionally Democratic states which elected conservative representatives, was of a broad loss of faith in “hope and change.”
For the Democratic party, it is imperative to regain those votes. It is from this priority that the President will paint a decisively positive economic picture during his upcoming speech. He hopes that by pointing to a falling unemployment rates, economic growth and higher confidence levels; it will give voters a sense of confidence in the President’s accomplishments.
The question is whether the majority of the voting public will agree with the President’s message?
Before the President takes to the podium with his bullish optimism, he might want to consider the following charts.
Government Debt
Since 2009, Government debt has surged by $7.75 Trillion and by the end of the next budget cycle will approach $20 Trillion in total. The problem is that during the current Presidential term, real economic growth has risen by just $2.08 Trillion. However, even this number is inaccurate as the current government debt levels do not include other liabilities of the government such as social security and other social welfare programs.
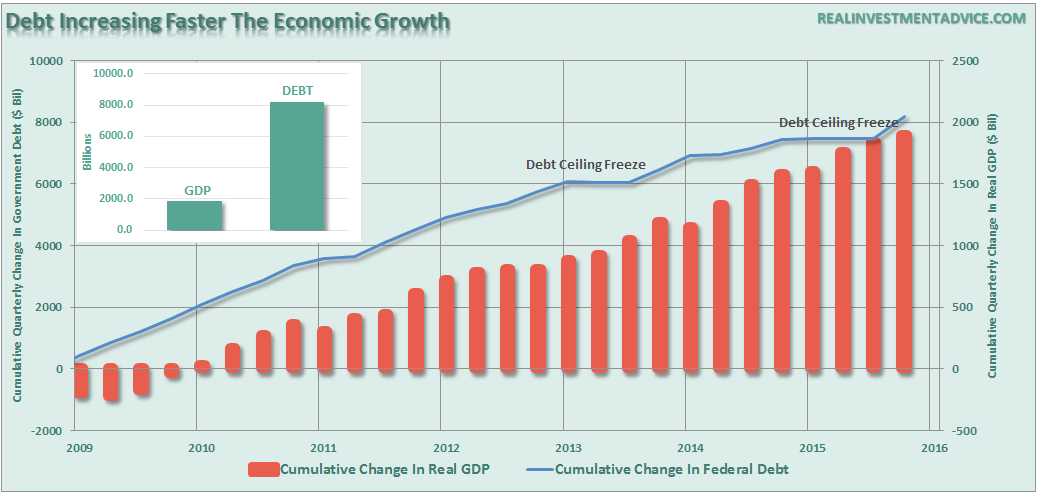
The following chart quantifies it a bit better when you look at cumulative increases in debt and real, inflation adjusted, GDP.
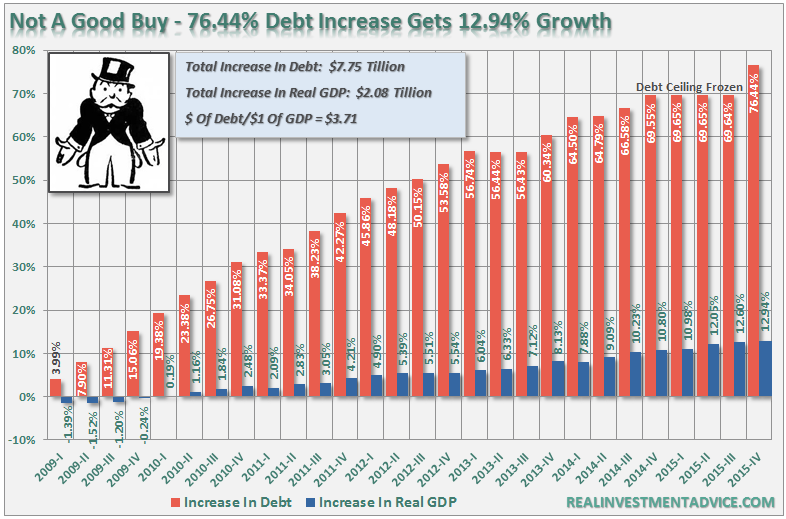
Yes, the economy is growing, however, that growth has come at a huge cost of a debt burden that will be amplified if borrowing costs rise with increases in interest rates. Furthermore, considering that President Obama admonished the previous administration’s increase in debt, the explosion in the amount of debt required to generate economic growth (currently $3.71) is unsustainable longer term.
Employment
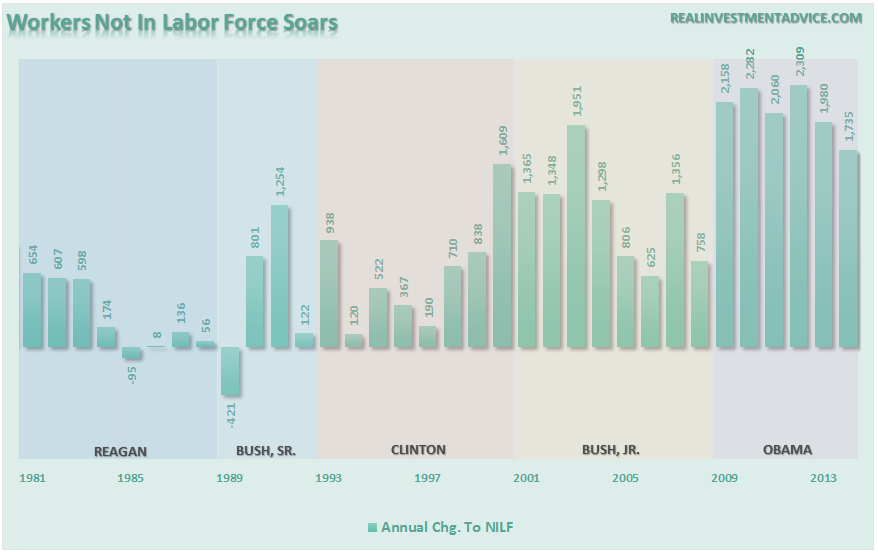
The President will address the recent employment report and point to a 5.0% unemployment rate as evidence that the economy “is back.” While the current Bureau of Labor Statistics employment reports do currently show the unemployment rate at 5.0%, that number is obfuscated by the more than 93 million workers that are currently not counted as part of the labor force.
As I have discussed many times previously, when it comes to economic strength it is full-time labor that leads to household formation and higher consumption.
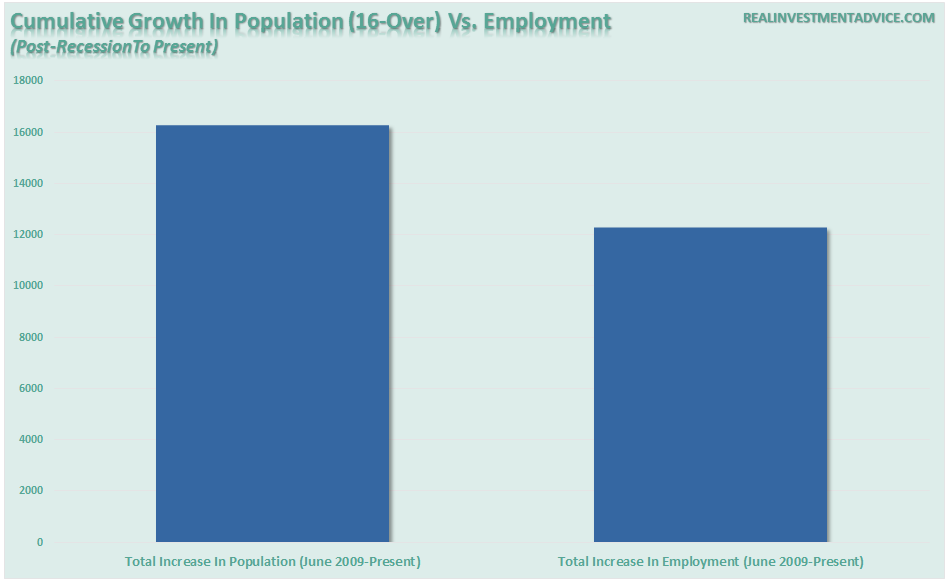
Furthermore, the rate of employment must be faster than the rate of population growth, otherwise, you are just treading water. The chart below shows the amount of full-time labor as a ratio of the working age population.
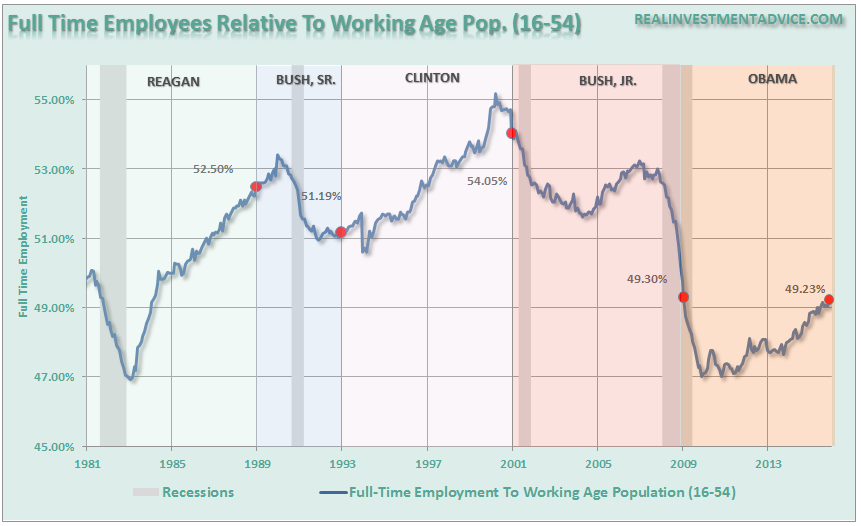
Currently, 49.23% of the population is employed full-time which is a rate lower than when the President entered office. Furthermore, as noted above, the employment ratios are deceiving when you realize that the population has grown faster than employment leaving a rising number of individuals no longer counted as part of the labor force.
Importantly, when the employment-to-population ratio or the labor-force participation rate is discussed, the plunging levels in these ratios are often dismissed simply as a function of the “baby boomers” heading into retirement. However, if we factor out those individuals by only looking at the employee-to-population ratio of 16-54 aged individuals as a percent of that age group the picture fails to improve.
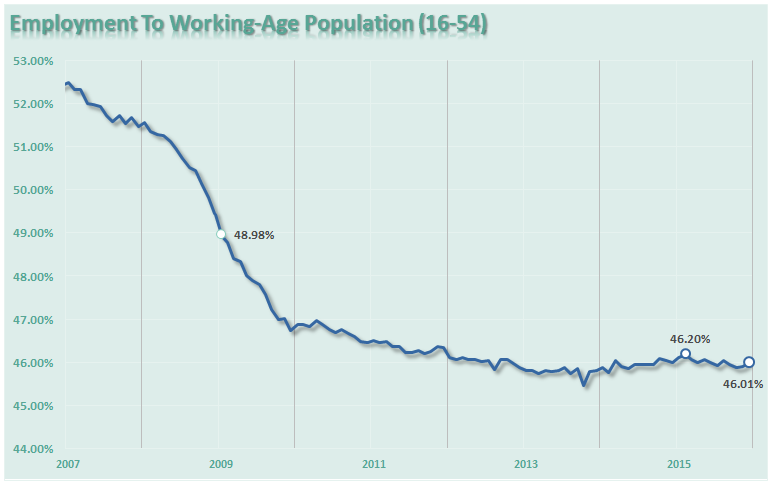
While the unemployment rate has certainly plunged to just 5.0%, one would be hard pressed to find 95.0% of the population that “wants to work,” actually working.
Personal Incomes
The annual rate of change in personal incomes has been on a decline since the turn of the century. This is a function of both the structural shift in employment (higher productivity = less employment and lower wage growth) and the drive to increase corporate profitability in the midst of weaker consumption.
The chart below shows the disparity between corporate profits and employment and wages.
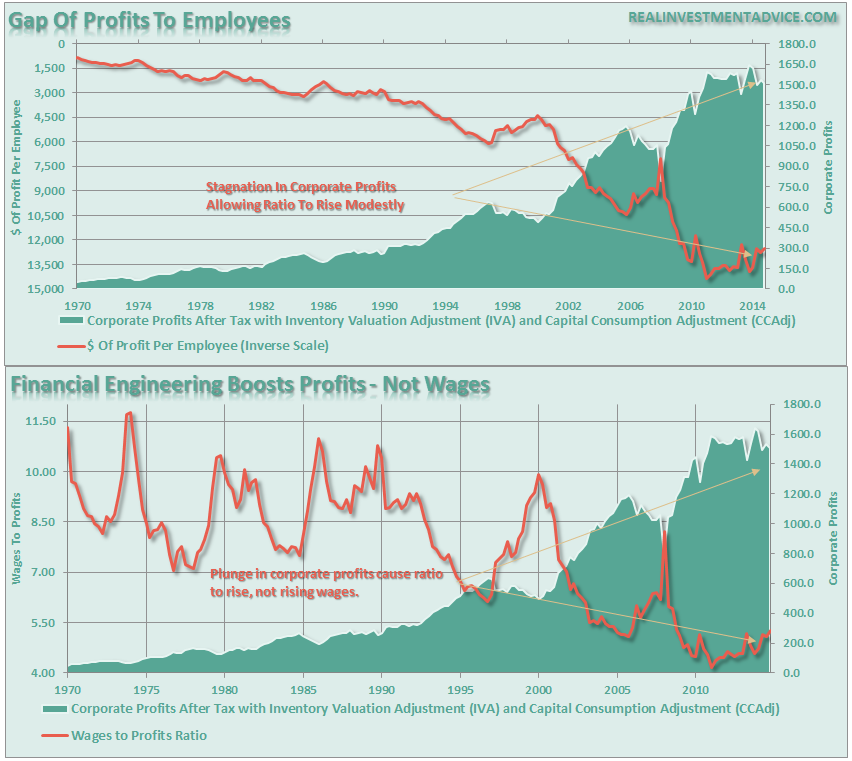
While corporate profitability has surged since the financial crisis, those profits have come at the expense of employees. Since 2009, wages for “non-supervisory employees,” which is roughly 80% of the current workforce has been on a steady decline.
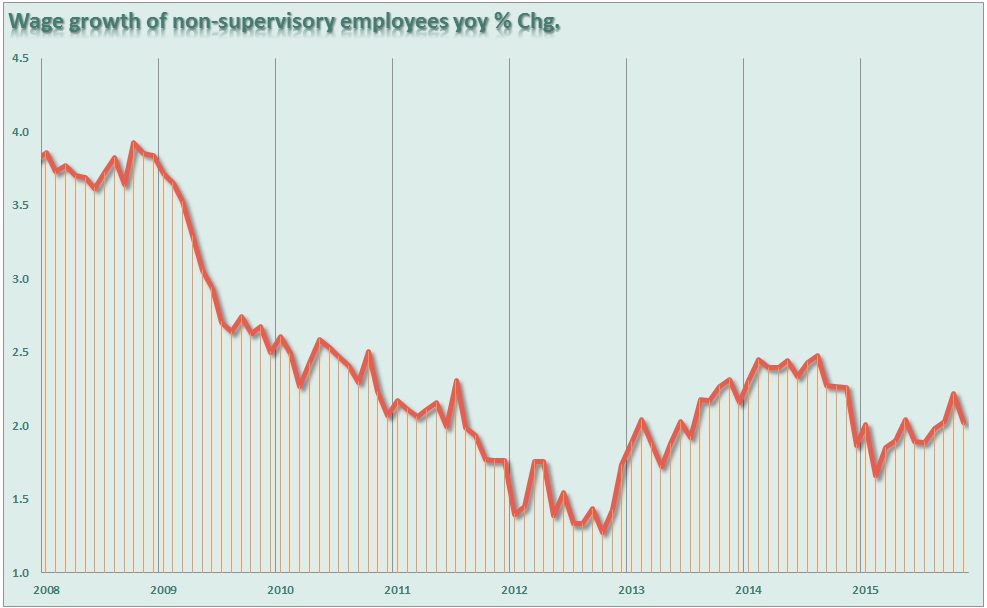
The problem with this, of course, is that the real cost of living continues to rise.
Government Assistance
Of course, the issue of declining incomes and rising “income inequality” is really best shown by the level of social benefits as a percentage of disposable incomes today. Today, roughly 1-in-3 households receive some form of government assistance.
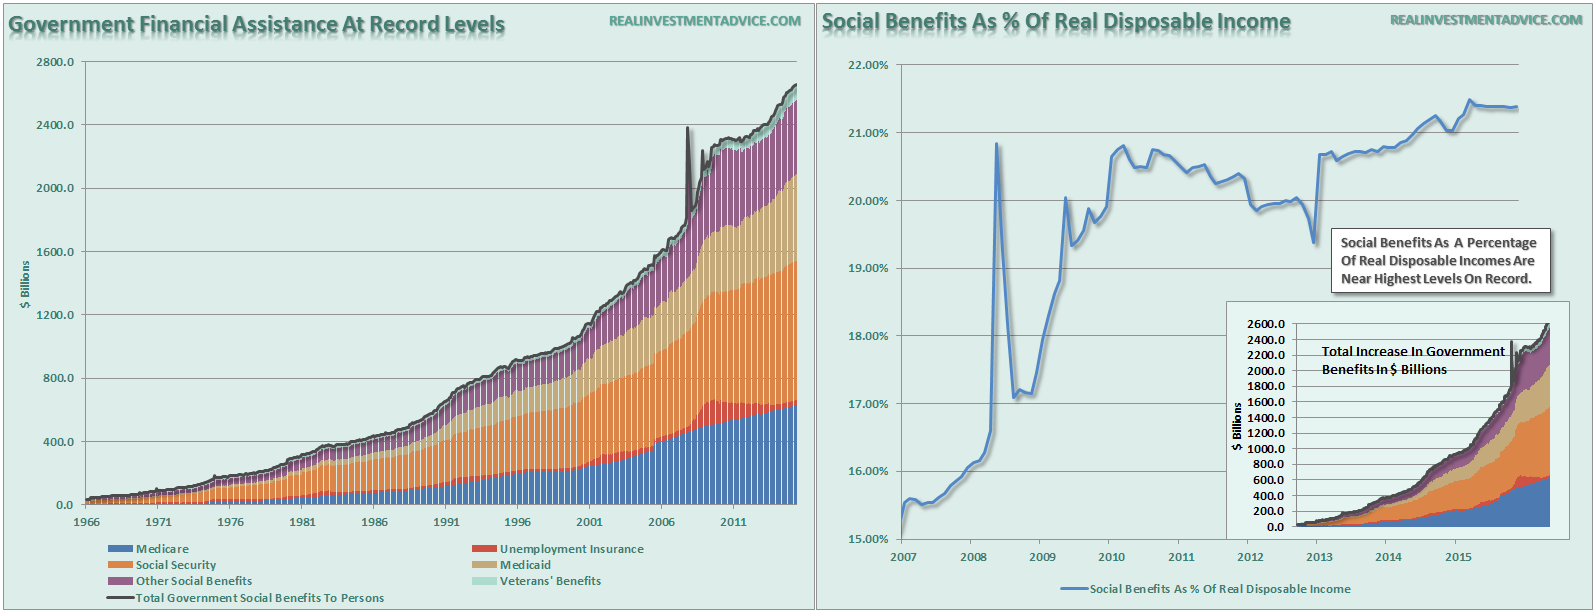
It is here that the President will be most challenged in presenting his “economic” story. While he will point to rising asset prices, improved headline employment numbers and economic growth as reasons to be “optimistic,” with almost 80% of the country living roughly paycheck-to-paycheck it will be a hard argument to win.
Housing
When it comes to the economy, it is home ownership that is the reflection of economic well-being. Since 2009, the government has poured trillions of taxpayer dollars into the housing market to try and increase activity. The effect of those injections has been marginal to say the least.
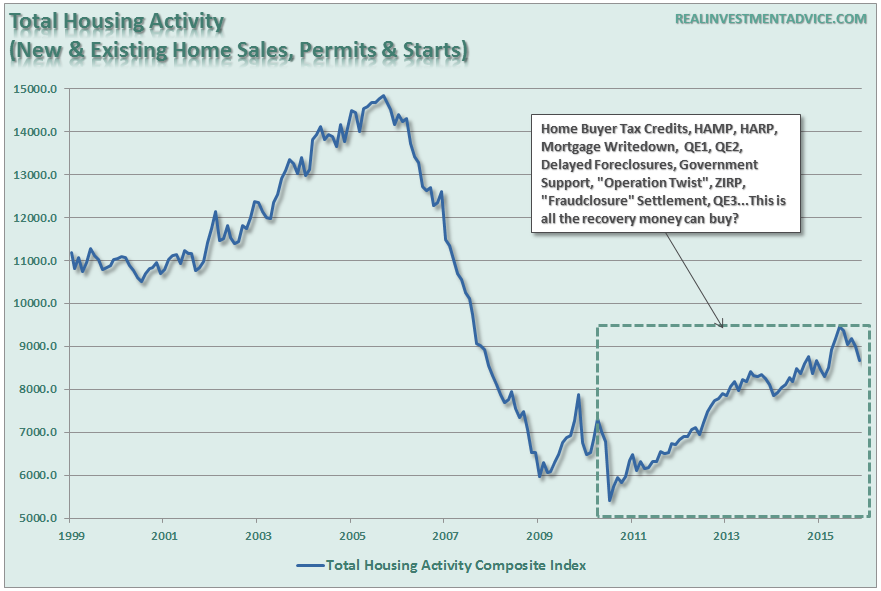
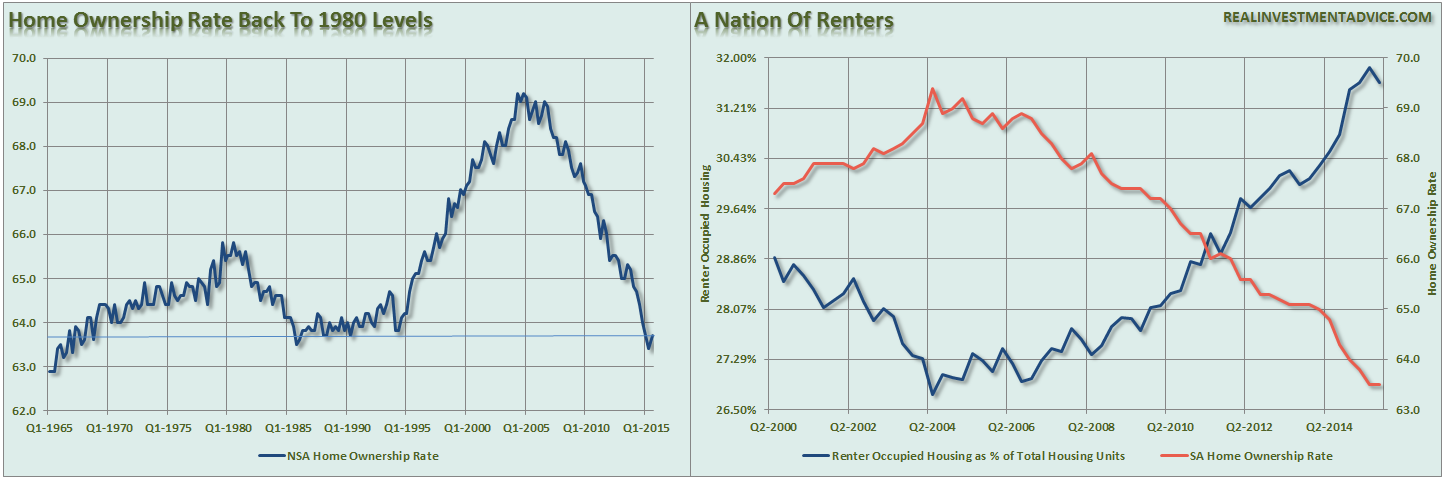
However, as I stated above, it is ultimately household formation that leads to higher levels of consumption and stronger economic growth. The current recovery, as shown by the chart below, was NOT driven by individuals buying homes to live in, but rather speculators buying homes, primarily for cash, and turning them into rentals. With homeownership currently near its lowest levels since the early 1980’s, it does not suggest a resurgent economy is in the making.
Economic Prosperity
However, it is the economic prosperity of an individual that truly determines how they will vote at the polls. A recent Fed Reserve survey of consumer finances shows the real disconnect between Wall Street and Main Street economics.
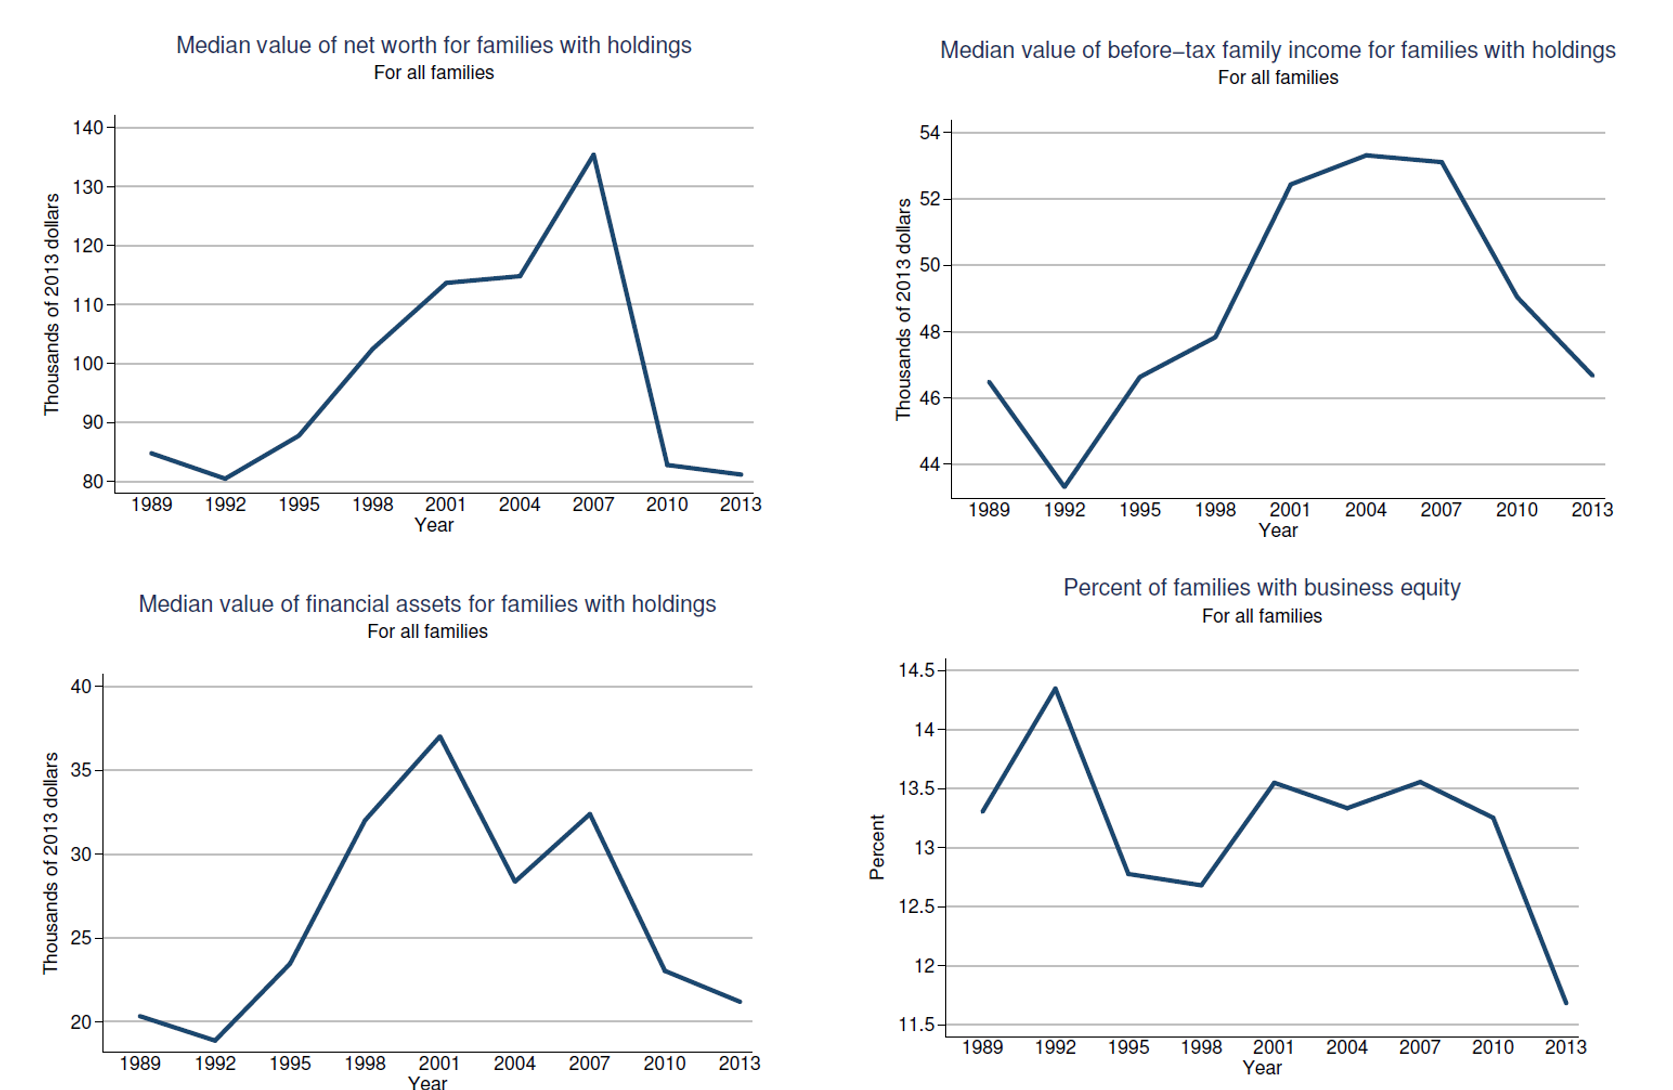
With net worth, incomes, financial assets and business equity ownership at levels substantially below where they were when the President took office, it is not surprising that the Administration is focused on trying to justify their record.
While the data, as reported by government agencies, has been massaged, tweaked, and recalibrated to provide more optimistic output, it is hard to fudge the economic standards by which the majority of the country lives with. Like a game of “Civilization,” the recent mid-term elections sent a pretty clear message that the “serfs” are not happy in the “kingdom.”
Defining The State Of The Union
While the President will do his best to put a positive spin on the current economic environment, and the success of his policies, when he gives his “State of the Union” address, it would be worth remembering whom he is actually addressing.
It is also worth considering that much of this is likely the reason that Donald Trump is surging in Conservative polling.
As with all things – it is the lens from which you view the world that defines what you see. For Wall Street, things could not be better. For Main Street, most everything could be better. The President has a lot of “convincing” to do if he expects to change voter’s attitudes between now and the 2016 Presidential election.
Lance Roberts

Lance Roberts is a Chief Portfolio Strategist/Economist for Clarity Financial. He is also the host of “The Lance Roberts Show” and Chief Editor of the “Real Investment Advice” website and author of “Real Investment Daily” blog and “Real Investment Report“. Follow Lance on Facebook, Twitter and Linked-In

