
Unlike most other more homogeneous nation-states on the planet, America was never rooted in a tribe, folk, people or nationality. To the contrary, it was a vast melting pot of diverse ethnicities and nationalities bound together by the ideas of personal liberty, constitutional democracy and free market opportunity and prosperity. America’s greatest period of growth and wealth creation from 1870 to 1914, in fact, was built on exactly those principles.
During that halcyon era the only document work-seeking immigrants needed was to sign-in at Ellis Island. No passports were required to enter the US until May 1918, and even that was the result of the anti-German hysteria elicited by Woodrow Wilson’s phony patriotism and crusade to make the world safe for his foggy brand of “democracy”.
Thus, in 1870 the population of the US was just 39 million. During the next 44 years more than 25 million immigrants entered the country. These new arrivals thus represented nearly two-thirds of the entire 1870 population!
Yet notwithstanding a half dozen short-lived recessions or “panics” during that interval,
real GDP growth averaged 3.8% per year for more than four decades running. That rate of continuous growth had not been achieved before, nor has it since.
During 1907, for example, 1.3 million immigrants entered the US, adding more than 1.5% to the existing US population (85 million) in a single year. Overall, during 1900-1910 nearly 9 million immigrants were admitted to the US, which amounted to about 12% of the nation’s entire population of 76 million in 1900.
By contrast, a century later the 13 million immigrants arriving during 2000- 2010 represented just 4.6% of the 282 million population in the year 2000. These comparisons thoroughly debunk the hysterical Trumpite claim that America is being over-run with immigrants.
During 2016, for instance, the net immigrant inflow peaked at 1.2 million. But that amounted to just 0.4% of the nation’s 325 million population, while by 2021 the net immigration figure of 247,000 was just 0.07% of the US population.
Accordingly, the 1.5% ratio of new immigrants to the total US population during the heyday of 1907 was 4X to 21X higher than the low and high ratios of recent years.
Likewise, immigrants during the pre-1914 golden age of economic growth and rising middle class prosperity represented a far larger share of the work force. Without them, the booming industrial belt from Pittsburgh through Youngstown, Cleveland, Toledo, Detroit, Gary, Chicago, Milwaukee, Rockford, Quad Cities and St. Louis simply would have never happened.
In any event, the foreign-born population peaked at just under 15% of the total US population during 1890 to 1914, and then began a long descent. This interim decline was triggered initially by the interruption of global commerce and labor mobility during WWI and then by the restrictive immigration act of 1924. The latter established immigration quotas based on national origin for Europeans, although it did not restrict immigration from the western hemisphere, including the Donald’s sh*thole countries of present renown.
So while total immigration was cut by 70% from the pre-1914 peak levels, it still exceeded 4 million during the economic boom of the 1920s. What caused the annual inflow to collapse to barely 40,000 persons per year during the 1930s was the Great Depression. Foreigners stopped coming when there was no work or economic opportunity—even when the new quotas would have permitted far larger numbers.
Number Of US Immigrants By Decade, 1820 to 2010
Indeed, the historic truth that immigrants came to America overwhelmingly for jobs and opportunity couldn’t be more obvious. Not surprisingly, therefore, when prosperity returned in the mid-1950s, annual inflows rebounded to the 300,000 per year level as permitted by the national origin quotas based on 1890 country-by-country levels. At length, however, the national origin system became unworkable, unfair and increasingly obsolete–so it was abolished in 1965. But its replacement was hardly any better since it was not governed by economics and work-seeking, either.
Instead, the overwhelming share of the new quota system was allocated to family reunification. This included unlimited slots for direct minor children and parents of U.S. citizens and 226,000 slots per year for family members of green card holders. Beyond that were 140,000 annual slots for professionals, scientists, artists and skilled workers in short supply, to be later defined by bureaucrats and business lobbyists. In the case of political refugees, the annual limit is determined by the President—with new annual arrivals varying between 20,000 and 80,000 annually since the year 2000.
Stated differently, the economically based, work-driven, quota-free system that
prevailed prior to 1914, and which had worked so brilliantly to fuel America’s industrial might, has been replaced by a politics driven system. The latter shifted the determinants of the flow and composition of immigration from the free market to the legislative and bureaucratic arenas of Washington, and to the vast networks of influence peddling and lobbying which drive action inside the beltway.
Not surprisingly, this evolution has increasingly turned immigration into a matter of pure partisanship. The Democrats now seek a route to electoral dominance through an immigration fueled increase in the non-white population, while the GOP fights a nativist rearguard action to preserve the electoral dominance of its Red State coalitions.
Still, notwithstanding the rigidities and anti-market nature of the current immigration control system, the dramatic rebound in the foreign-born share of the US population in recent decades was materially driven by economics and work-seeking. The agricultural industries, hotel and restaurant sectors, lawn and home care, domestic service and countless other lower-skilled sectors are testament to that truth.
Unfortunately, the Trumpites have buried this true immigration history in the Donald’s unhinged attack on capitalism. After all, free labor markets are just as crucial to capitalist prosperity as are free markets for goods, capital, technology and enterprise. Trumpian walls, border patrols and ICE raids, in fact, amount to statist Big Government writ large.
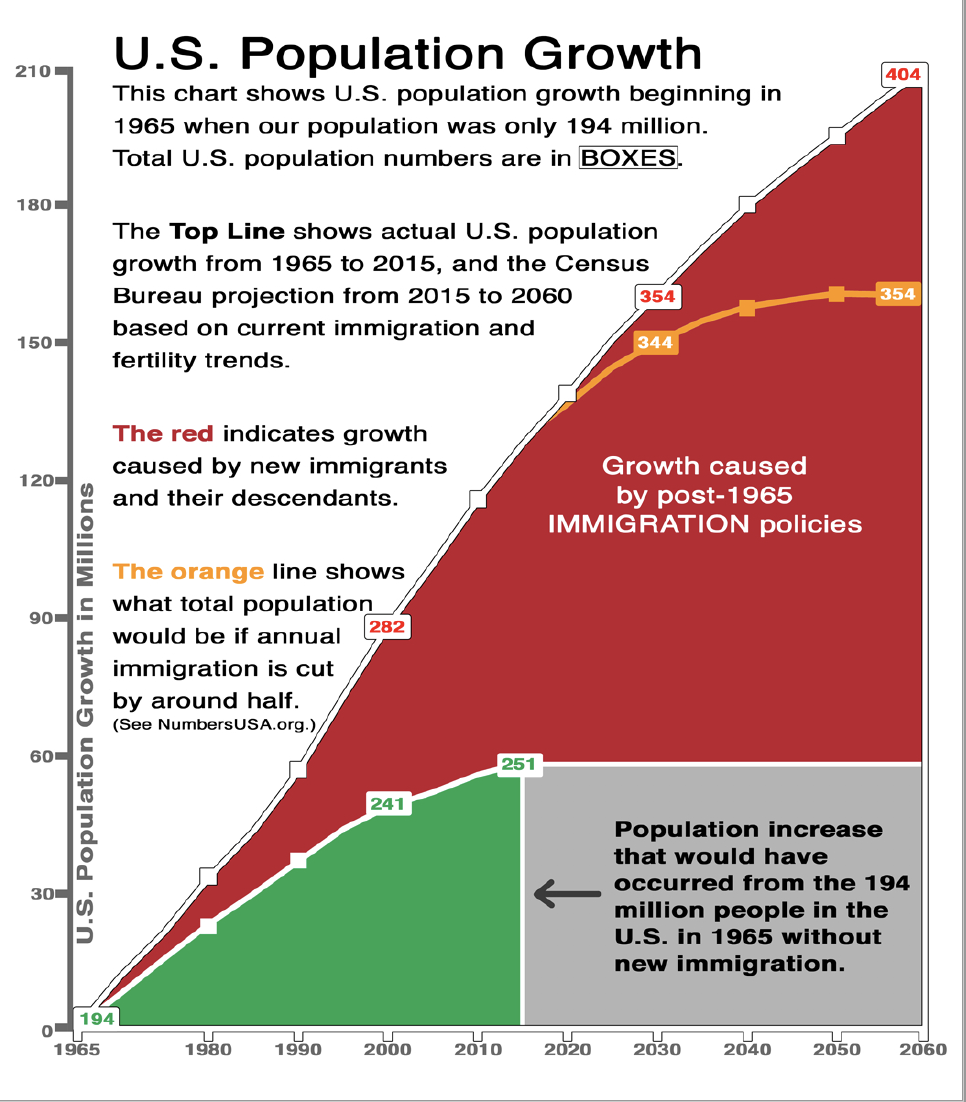
At the end of the day the Trumpite effort to close the borders amounts to a denial of history and negation of the very force that created the largest and most prosperous economy and middle class in world history. In fact, the chart below is a reminder of the stunning ignorance that underlies the Trumpian attack on immigrants.
It shows that the 194 million US population of 1965 would have grown to just 251 million at present (green and gray areas) absent post-1965 immigrants and their descendants. That is, once the baby boom fully arrived, existing American families implicitly chose to have only enough babies to keep the US population constant as far as the demographer’s eye could see, but at least through 2060.
As it has happened, of course, the US population has grown to about 335 million at present due to post-1965 immigrants and their children and grandchildren. And under policies extant before the Donald and his wall-building mania arrived on the scene in 2017 that figure would have grown to 404 million by 2060, thereby accommodating at least modest growth in the future labor force.
But under the Trumpian close-the-borders ukase much of that growth could vanish. The yellow line, for instance, shows that nearly three-fourths of projected population growth from the present level thru 2060 would be eliminated if the number of immigrants were to be cut by 50% from pre-2015 levels.
Ironically, therefore, the only way to give the US economy a fighting chance to shoulder the tsunami of public debt expense and Welfare State retirement spending that is coming down the pike at an accelerating pace is to import millions of new workers.
That’s because, self-evidently, potential native-born moms have already taken a pass on baby-making. In its Trumpian stupor, therefore, the GOP has actually become at once the anti-supply side party and the political battering ram for a guaranteed fiscal calamity in the decades ahead.
And we do mean calamity. The public debt is already baked into the cake at $50 trillion by the early 2030s and will exceed $100 trillion by mid-century. At the same time, the Baby Boom is flooding onto the retirement rolls, where it will be collecting lavish levels of benefits that were never earned in an insurance sense, but simply granted by legislative fiat as a transfer from future workers to present retirees.
In fact, the number of Baby Boomers over 65 years of age will have grown from 21 million in 2016 to nearly 78 million by 2030. That’s nearly 50 million more retirees in just 15 years—a stunning testimony to the pig-through-the-python nature of the nation’s demographics.

In all, the retirement rolls in the US are climbing inexorably higher and the rate of gain will actually accelerate after 2030, climbing to 82 million by 2040 and nearly 100 million by 2060.
Accordingly, in the absence of robust immigration the declining number of native-born workers wouldn’t stand a chance. They would be literally crushed by the never before imagined level of payroll taxes that would be needed to keep Social Security, Medicare and the rest of the retirement complex minimally funded.
So if today’s younger cohorts vote for Donald Trump in 2024 in order to keep immigrants out of America, they will surely rue the day.
More importantly, the bracing retirement growth curve shown in the graph below means that America really has no time for Donald Trump’s juvenile anti-immigrant antics and wall-building charades. The very idea of locking down the borders in the face of a screaming demographic deficit and shrinking labor force when the nation’s social insurance burden is climbing skyward is just plain nuts.
![Number of persons 65 years of age or older. 1900–2060 [4]. U.S Census ...](https://www.researchgate.net/publication/306088069/figure/download/fig2/AS:394609646686225@1471093679284/Number-of-persons-65-years-of-age-or-older-1900-2060-4-US-Census-Bureau-Population.png)
For avoidance of doubt, consider the crucial fiscal math shown in the graph below. Whether we get the weak labor force growth built into current demographic projections, or none at all if the Trumpite border closers prevail in Washington, the ratio of workers to retirees is fixing to plummet. What had been the 5:1 ratio as recently at the turn of the century will decay to just 2.5:1 by 2040 under optimistic work force assumptions, and continue to fall thereafter.
Needless to say, under Trumpian immigration policies the nation would reach in the not-too-distant future the point where every two workers will be carrying one retiree on their backs in terms of payroll taxes. And that’s to say nothing of the onerous income and other general taxes that will be needed to pay multi-trillion dollar annual interest charges on the public debt and to fund the mushrooming costs of the Warfare State and Welfare State outside of social insurance.
Either that or there will be thundering political carnage if the current built-in 30% benefit cuts are triggered when the OASDHI trust funds become insolvent early in the next decade. That is to say, the very last thing that the American Republic can afford under these circumstances is four more years of Trumpian bombast about closing the borders and complacency about the ballooning public debt.

Moreover, it also needs be understood that the implied tax burden increases are even more severe than suggested by just the plummeting worker-to-retiree ratio. That’s because Social Security is ultimately a Ponzi Scheme in which all retirees receive substantially more in lifetime benefits than they paid in payroll taxes during their working years.
That’s partially due to the progressive wage replacement formulas in the benefits schedule and also due to the fact that life-time wages are indexed for both inflation and productivity during the period in which workers were paying into the system.
The latter is problematic in its own right because wages earned by a 20-year-old are escalated for both inflation and all productivity gains during the next 47 years of his working lifetime. For instance, if a hypothetical worker had earned $5,000 in 1975 and retired in 2022, those wages would be indexed by 7.01X, or to $35,000 for purposes of calculating the monthly Social Security benefit.
And if this worker had been a low-wage worker his entire life, the benefit replacement rate for these indexed wages (AIME or average indexed monthly earnings), would be 90%.
Not surprisingly, this structure of wage indexing and progressive benefit formulas results in a vast disconnect between the present value of payroll taxes paid and benefits received. Based on 2021 dollars, here are the taxes-to-benefits ratios for seven typical beneficiary types.
Constant Dollar (2021 $) Lifetime Taxes Versus Benefits=Ratio
- Single Low Wage Worker: $195,000 Taxes/$481,000 Benefits=2.46X;
- Single Average Wage Worker: $434,000 Taxes/$615,000 Benefits=1.41X;
- Single High Wage Worker: $694,000 Taxes/$725,000 Benefits=1.04X;
- Married Couple, One Low Wage Worker: $195,000 Taxes/$934,000 Benefits=4.79X;
- Married Couple, One Ave. Wage Worker: $434,000 Taxes/$1,162,000 Benefits=2.68X;
- Married Couple, One High Wage Worker: $694,000 Taxes/$1,348,000 Benefits=1.94X;
- Married Couple, Two Ave. Wage Workers: $867,000 Taxes/$1,303,000 Benefits=1.50X.
In short, under even steady-state population conditions, the Social Security/Medicare trust funds would inherently go tilt because virtually the entire population gets far higher benefits than they pay in taxes. And there are no working period returns on accumulated “pension” assets, either, because the system has been pay-as-you go since the 1960s.
Accordingly, the only way the system can remain even remotely solvent is under conditions of strong, sustained growth in both productivity and the number of workers employed. Alas, the data show that both factors have been dramatically fading since the turn of the century.
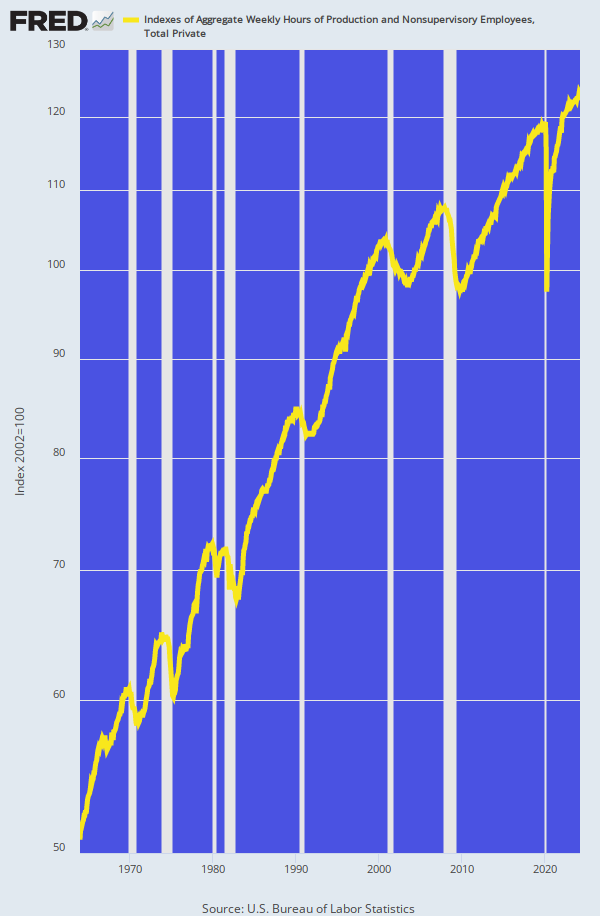
For all the reasons mentioned above, the growth rate of the bottom-line metric for labor supply—the index of aggregate hours workers by the US labor force—has been heading south for the last two decades. Between 1964 and 2000, for instance, the index rose by a robust 2.0% per annum, but since the turn of the century the growth rate has dropped by nearly three-fifths to just 0.8%.
And that’s just the backward-looking trend per the graph below. Without a large-scale Guest Worker program, the growth rate during the next several decades would be lucky to average even 0.2% per annum or, effectively, become a rounding error in the scheme of prior history.
Index Of Aggregate Hours Worked By Private Sector Employees, 1964 to 2023
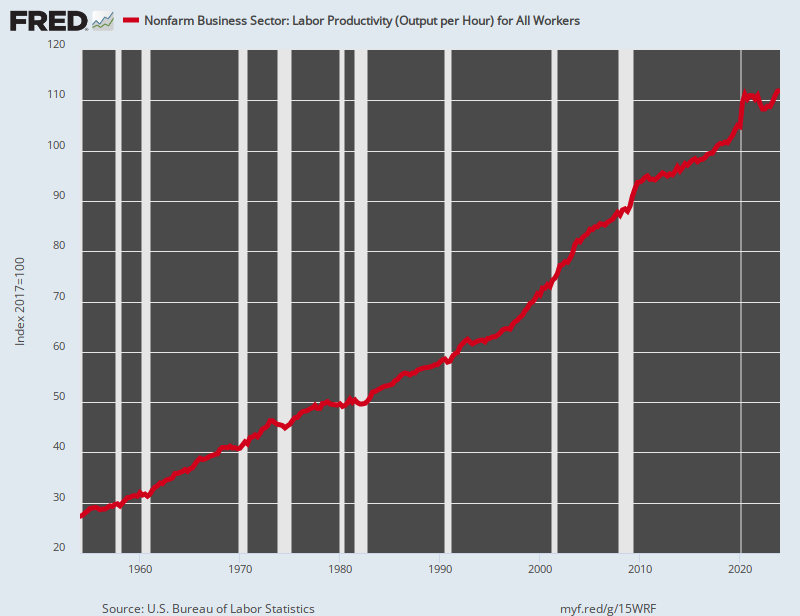
Likewise, you don’t even need a magnifying glass to see that something ominous is happening to the seven-decade long productivity trend shown below. Productivity growth peaked 10 quarters ago and now stands 2% below its Q3 2020 level.
Needless to say, the recent downward hook depicted in the graph has never before even remotely happened. And even when you credit the artificial surge in early 2020, which was ironically caused by the massive lockdown furloughs (i.e., output fell far less than payroll counts), productivity growth has slowed dramatically.
The historic productivity growth trend was 2.80% per annum between 1954 and 1973 and 2.11% during the half century through the year 2000 as a whole. But the growth rate has now slumped to just 1.05% since Q1 2012. That’s just two-fifths of its pre-1973 trend and half of the per annum gain recorded during the entire second half of the 20th century—and even those tepid figures assume that the current negative growth rate will right itself forthwith.
Index Of Nonfarm Labor Productivity, 1954 to 2023
The collapse of productivity growth since 2012 is not just a statistical curiosity, however. Even the New York Times dyed-in-the-wool Keynesian economics commentator, Paul Krugman, once noted that—
Productivity isn’t everything, but in the long run, it’s almost everything.
The reason productivity is nose-diving, of course, is the succession of money-printers at the Fed, most of whom—-Greenspan, Bernanke, Powell—were first appointed Chairman by Republican presidents.
But the verdict of their monetary apostasy is now clear as a bell. During the last two decades the capital markets have been mangled by relentless financial repression and ultra-low interest rates. That is to say, the sustained negative real cost of short-term funds on Wall Street has been a carry-cost bonanza for leveraged speculators.
Moreover, the Fed’s belated pivot to inflation-fighting has not nearly undone the damage. As of June 2023, the real Fed Funds rate was still -0.5%. and had been in negative territory for 96% of the last 184 months.
This bespeaks of damage to productivity growth that is nearly beyond measure. It has fostered immense levels of malinvestment and unproductive speculation that would never occur on a free market operating with honest money.
Likewise, the negative real cost of long-term debt has caused PE ratios to soar, thereby incentivizing the C-suites of corporate America to seek stock-option wealth via Wall Street based financial engineering schemes rather than old-fashioned internal investment in the business.
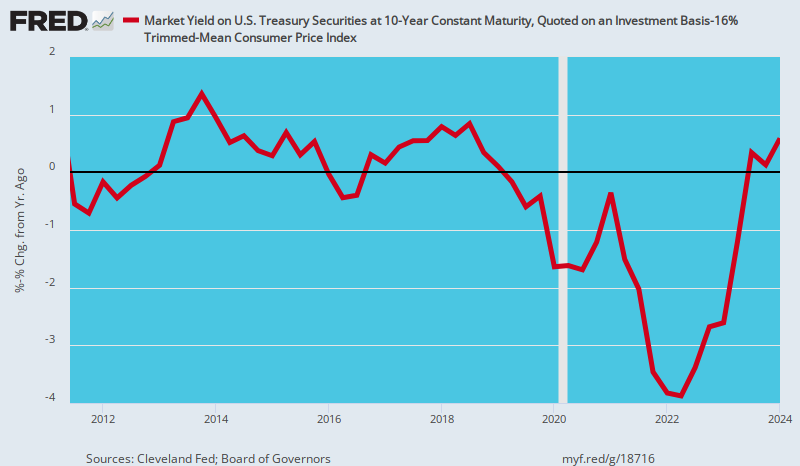
Needless to say, the capital market distortions from years of financial repression are not close to being reversed, either. As of Q2 2023, the real 10-year UST yield was still -1.2%, and that’s after a decade in which real yields have been negative (or only slightly positive) virtually all of the time.
Indeed, the chart below is the real smoking gun. The 10-year UST is the reference value for the entire financial asset market—stocks, bonds and real estate. Yet owing to Fed policy those asset classes have been drastically mispriced for years on end.
Inflation-Adjusted Yield On 10-Year UST, 2011 to 2023
The result has been a sweeping re-allocation of capital market flows from productive investment in plant, equipment, technology and work force upgrades to rampant financial engineering. The latter has totaled $25 trillion in stock buybacks and largely unproductive M&A deals over the last two decades.
As we have previously pointed out, the result has been flat-lining business investment after inflation and depreciation since the turn of the century. And that’s about as anti-supply side as it comes.
At the end of the day, the US economy desperately needs a huge increase in the number of workers and a dramatically stepped-up level of investment in productive assets in order to re-accelerate economic growth, and thereby handle the tsunami of 100 million retirees coming down the pike. These requirements, in turn, necessitate a revival of supply-side policies appropriate to current conditions.
To be sure, reduction of marginal income tax rates are always welcome—-if compensating spending cuts are also made to eliminate current massive deficits and to compensate for the inherent revenue loss from lower tax rates. And, no, Art Laffer, marginal rate cuts from current levels do not pay for themselves. Not even remotely.
Instead, the supply-side policies actually needed today are a large-scale Guest Worker program and the abolition of the FOMC and return to the market-based discount window upon which the Fed was originally based. That would put the free market in charge of the Fed’s printing press as its original architect, Congressman Carter Glass intended.
So the question recurs. Does Donald Trump have any clue whatsoever with respect to these crucial supply-side requirements?
Well, the essence of the matter is more labor and less money, even as the Donald loudly and militantly demonstrated during his four years in the Oval Office that he stands for less labor and more money.
So, as the man said, “nuff said!”

