
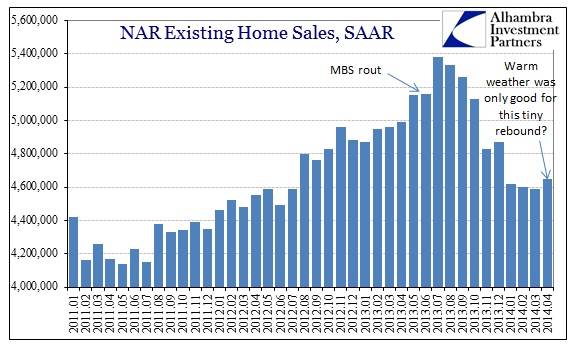
The depressed level of existing home sales throughout 2014 so far continued into April despite all projections of pent up demand after a cold and wintry start. There was some growth in the month-to-month change of the seasonally adjusted figures, but even there the clear problem that has been evident since mortgage finance collapsed starkly remains. While it may be encouraging that April was at least better than March, there was also a small rebound in December over November that told us nothing about the future path other than to remind about normal monthly volatility.
Protestations aside, the future of real estate will be decided by these financial factors, including both mortgage finance and household impoverishment.
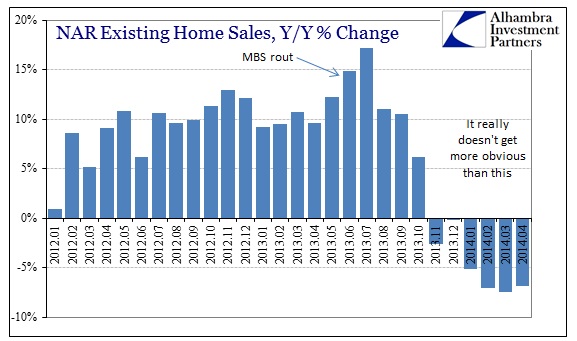
The true pattern really jumps out when viewing these figures Y/Y.
First time home buyers continue to be absent from the housing market. The level of this category of purchasers remains at about only 29% of all sales. That speaks to both affordability (lack of) and household formation. It also shows clearly the shortcomings of the continuous appeal to the insidious “wealth effect” as it fails to trickle to anyone other than those directly experiencing asset inflation.
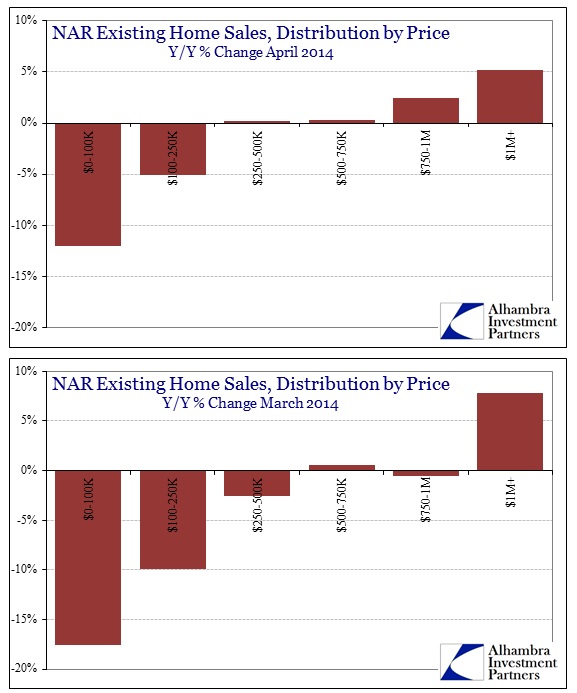
The overall distribution of sales was better across all segments except the highest, but the distribution remains heavily skewed in that direction.
With all that in mind, there is a new development that may influence future price gains and overall housing momentum. First, the NAR estimates that the average home price was up only 3.7% in April, down significantly from the 7.1% gain in February. The median price fared somewhat better, as you would expect given the persisting favorability of higher end sales, but the price growth is also clearly decelerating there too. Median home prices were up only 5.2% in April, down from 8.7% growth in February and a 13% increase in August when this mortgage mess (driven by taper threats) really began to strike.
The deceleration in bubble pricing, particularly in the past few months, is somewhat unsurprising as inventory levels have gained dramatically alongside the drop in sales pace. That is a very unwelcome trend. The NAR, in particular, has been trying to “sell” this housing market on a “shortage of homes for sale.” That may have been the case when sales growth was at a high point last summer, but it is no longer evident now.
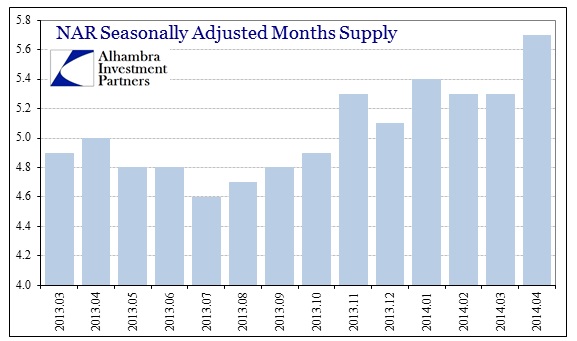
In some important markets, particular those like Phoenix, AZ, inventory levels are through the roof (+49% Y/Y).
Combined with construction, the real estate market is once again searching for a bottom. Artificiality giveth; taper taketh. The economic growth offset? Conspicuously absent.
Click here to sign up for our free weekly e-newsletter.
“Wealth preservation and accumulation through thoughtful investing.”
For information on Alhambra Investment Partners’ money management services and global portfolio approach to capital preservation, contact us at: jhudak@alhambrapartners.com

