
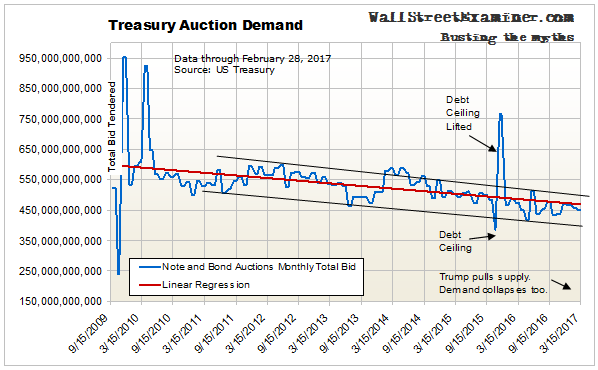
Demand for Treasury coupons, as measured by the total bid at each auction remains in a downtrend. When the Trump Treasury sharply reduced supply from late January to the end of February, demand slipped along with it. All the usual suspects who bid for Treasuries did not stick around to bid when there was less supply. Some took a walk or reduced the size of their bid instead of bidding up prices and lowering yields.
The total bid at the February auctions was $450 billion, down $10 billion from January, and a $150 billion drop from December. This is part of a secular trend that has persisted since 2010. There’s no evidence, nor any reason to think, that this will change in the foreseeable future.
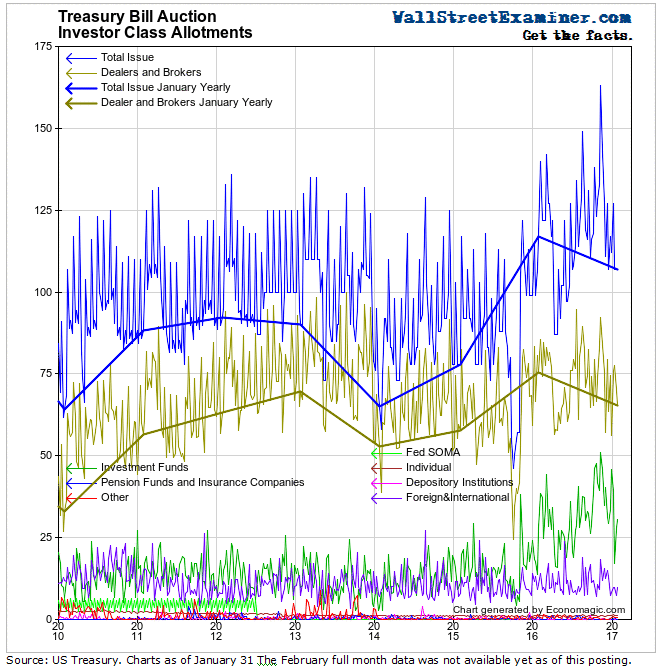
T bill issuance fell year to year in January. The dealer takedown was lower and was still well below the past percentages of the total issuance. Investment funds continue to absorb significantly more of the issuance than they had historically. That uptick began in late 2015 and has continued. These funds have built up a big hoard of these near cash holdings, while dealers have moved toward holding less short term government paper.
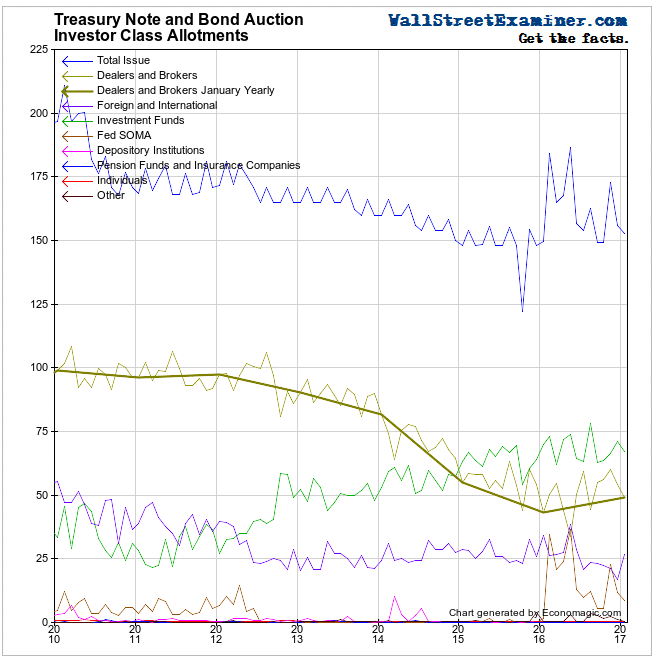
In the institutional end of the market, the dealers tend to be the smarter money and institutions tend to be the dumber money. The above chart suggests that dealers have been redeploying cash into other assets. They have driven the rallies in stocks and bonds.
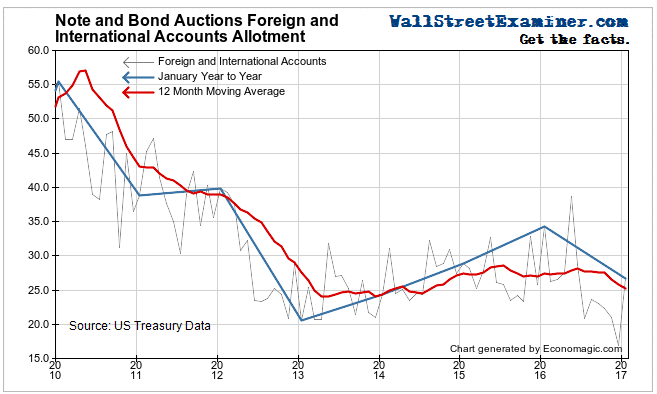
Foreign buying of Treasury bills weakened year to year in January. The 12 month moving average had shown minor strength in 2016, but it has edged lower in recent months. Some foreigners are liquidating T-bills to raise cash. 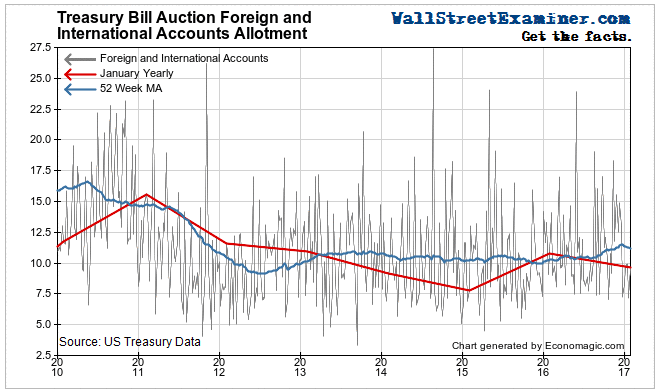
The Treasury moved a few year end settlements to January 3. That showed up in the January numbers making it appear as though dealers had increased their takedowns. That was not the case. The February data should reverse this. It is not yet available as of this writing.
The January number for foreign allocations is also boosted by the Treasury moving some normally December settlements to January 3. But in spite of that boost, foreign takedowns collapsed vs. a year ago. That indicates continued weakness in foreign demand, which in the past was a big driver of the bond rally. Without it, bond yields should continue to see upward pressure.
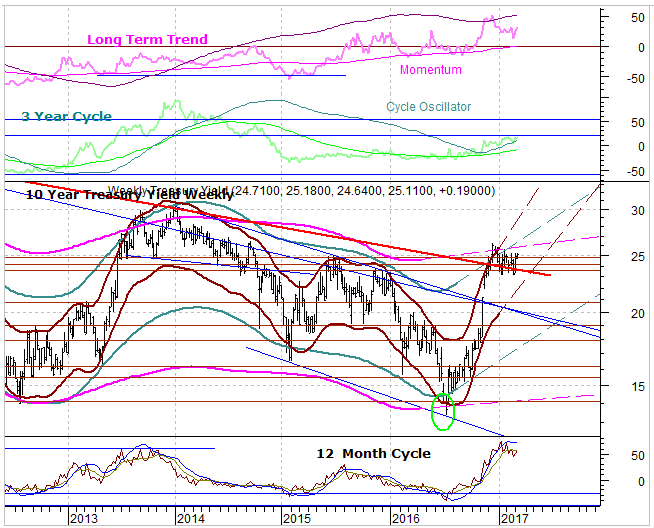
The 10 year yield continues to hover around a trendline dating from the 2010 high. The 10-12 month cycle has entered a down phase. If this consolidation continues to hold above the 2.35 vicinity, it would suggest that the uptrend will resume, probably after mid year. However, a drop below support at 2.31 would open the way for a move back to the 2.08 area. That would leave the long term trend in question. A breakout above 2.65 would confirm the uptrend and signal the likelihood of the next target being the 3.0 area. Long term indicators still favor higher yields after this correction.
Primary Dealers cut their Treasury coupon positions as well as MBS and corporates in the 4 weeks ended February 22. It was the second straight month in which they cut their corporate holdings. They increased their holdings of Agencies slightly. On the whole, they got much less long than they were in January. Their long positions in Treasuries are now at the 1 year moving average, which has turned flat and may be rolling over.
This is once again a major inflection point that could signal the death of bonds if dealer long positions shrink from here. That would also be a warning sign that the blowoff in stocks is not long for this world. A breakdown in the bond market led the 1987 stock market crash by 5 months.
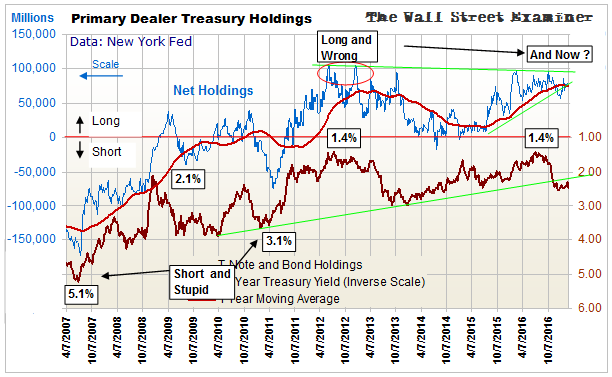
The dealers hedge their cash positions in the futures markets. Dealer positions in Treasury coupon futures of all durations for the week ended February 28, 2017 were net short approximately 843,000 contracts with a face value of $84.3 billion. That was a big increase in short positions from the 667,000 contracts with a face value of $66.7 billion at the end of January.
This was the fourth straight monthly increase in their net short positions in futures and by far the largest. Perhaps more importantly, they were cutting their cash long holdings at the same time.
The value of their long cash positions in T-notes and bonds was $89.5 billion, down from $106.2 billion 4 weeks before. On balance, considering both the futures and cash positions, the dealers were net long cash Treasuries versus futures by approximately $5 billion, down from $19 billion 4 weeks before. This is below their smallest net long position of the past year of $9 billion set last August. If this trend continues, and particularly if it goes net short, it would mark a sea change in Primary Dealer positioning. It would be a bearish sign.
Foreign Central Bank (FCB) Purchases The Fed’s custodial holdings of Treasuries and Agencies for FCBs rose by $17 billion for the 4 weeks ended March 1. This rebound came from a higher low set in early February. FCB buying has been uptrending slightly since November. That buying has helped to provide additional liquidity for US markets.
The overwhelming demand for dollars around the world had been causing dollars to pile up in the reserves of FCBs. They then recirculate those excess dollars into the purchase of US Treasury securities. In spite of the FCBs recirculating a tidal wave of dollars back into the Treasury market, it did not cause a decline in bond yields. Instead, yields have remained firm. This shows just how weak demand is from other buyers.
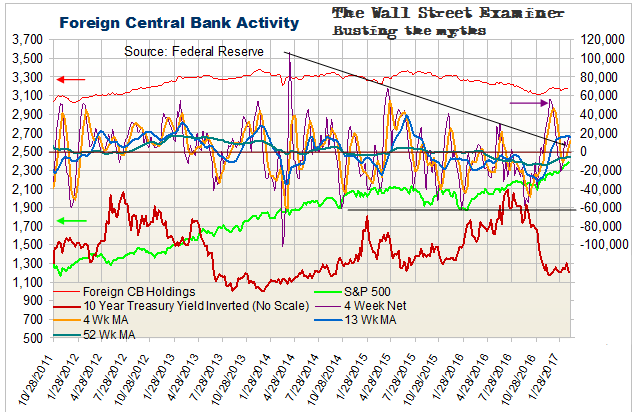
The extreme lows in FCB buying in September-October foreshadowed rallies in both bonds and stocks. Now the question is whether those rallies have played out. This indicator doesn’t provide an answer yet.
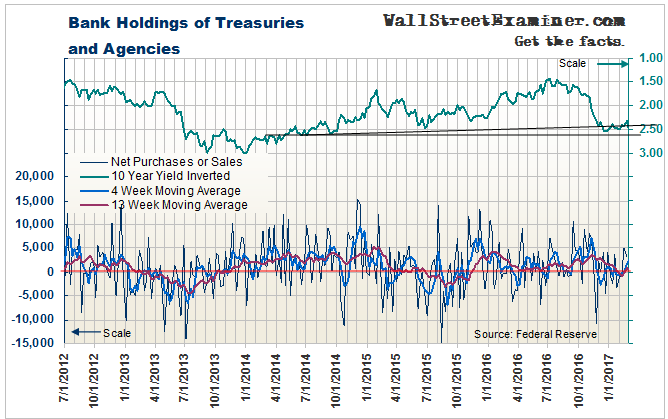
US commercial bank holdings of Treasuries and Agencies rose by $6.7 billion in the 4 weeks ended February 22, 2017. The 4 week moving average rose from the zero line while the 13 week moving average had a small uptick from that area. These signs suggest that US banks have moved into buying mode over the past couple of months.
The numbers are relatively small, but it’s a bullish influence nevertheless. On the other hand, the pattern of lower highs over the long run has bearish implications. If this line drops into negative territory, the odds would favor resumption of the decline in bond prices and rise in yields. However, if banks increase their buying, a bearish move in the bond market could be staved off for a while longer.
This report is excerpted from Lee Adler’s Wall Street Examiner Pro Trader Monthly Treasury Supply and Demand Report.
Lee first reported in 2002 that Fed actions were driving US stock prices. He has tracked and reported on that relationship for his subscribers ever since. Try Lee’s groundbreaking reports on the Fed and the Monetary forces that drive market trends for 3 months risk free, with a full money back guarantee. Be in the know. Subscribe now, risk free!

