
If you are an investor and are heavily long the markets, this would be a good time to prepare for impending doom. US banking indicators are on the razor’s edge of signaling the end of the speculative financial engineering bubble. Any further weakness in banking indicators would suggest that that bubble has begun to deflate and that we are in the early stage of a bear market in both stocks and bonds. Being this close to the edge requires a lightning quick reaction to any additional decline in these indicators coupled with a significant drop in stock prices.
In practical terms, it suggests that the use of trailing stop orders is a good idea. When I’m recommending short term trades I set my stops at short term trendlines or obvious short term support levels, where the market previously made a minor low and rebounded.
On longer term holdings under normal circumstances I might allow for a drop to long term trendlines or previous intermediate lows. Under current conditions I would want to raise my stops to intermediate trendlines or support levels. Those could be adjusted to short term trendlines and support levels as the risks appear to grow.
Aggressive traders could put out a few pilot shorts, with protective stops above obvious resistance levels.
Here are some of the indicators that are cause for concern.
Bank loans fell in February. That ended a nearly 4 year string of all time records each month. The annual growth rate fell to 4.9% as of February 24. That’s down from 6% in December. It continues slowing growth that has steadily come down from 7.4% in September. The growth rate had been between 7% and 8.5% since December 2014.
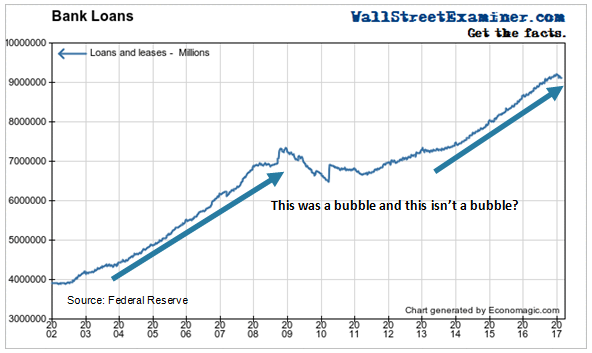
It’s too early to call this a trend change, but some of the speculation that had driven the economy and the markets has bled off. That bears watching.
Lending not related to financing securities holdings includes both consumer lending and commercial and industrial lending, but excludes securities financing. These loans fell in February for the second straight month. A slight decline is common for the first month or two of the year, but the current decline looks slightly larger than usual.
The annual growth rate has been slowing dramatically. It has now dropped to 5.5% from nearly 8.5% in mid year 2016. While this growth rate is still greater than the growth rate of the economy, the rate and persistence of the slowdown in growth greater than any decline since the recession bottomed in 2009. The air may be coming out of the credit bubble that has driven the markets berserk on the upside.

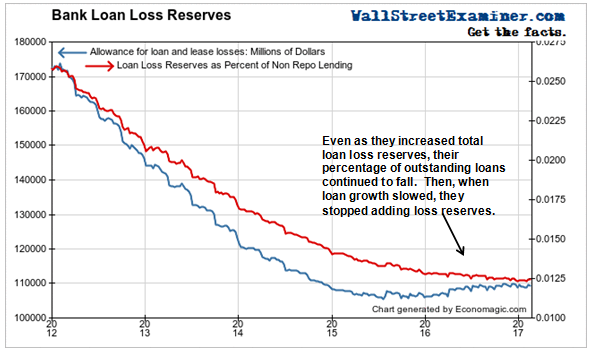
Bankers grew their loan loss reserves slightly from mid 2015 to mid 2016. However, that fell short of the growth in loans, so that their percentage loss reserves kept falling. Loan growth has slowed in recent months, but the banks stopped increasing their loss reserves in the middle of last year. This is an accident waiting to happen, when the US economy slows from its current weak levels.
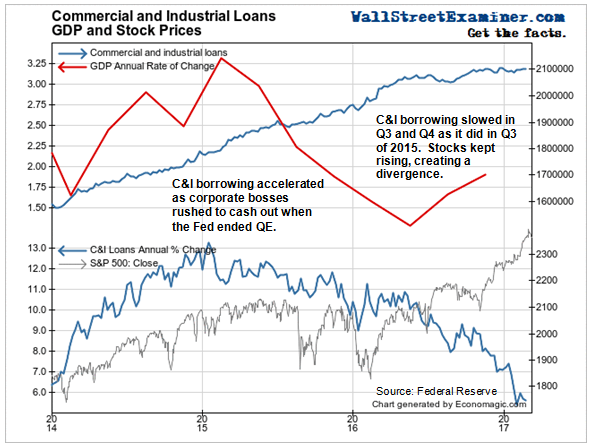
Commercial and Industrial Loans have not grown at all since October 2016. However, the annual growth rate stabilized, edging down to 5.6% at the end of February from 6% the month before. That’s down from more than 13% in early 2015.
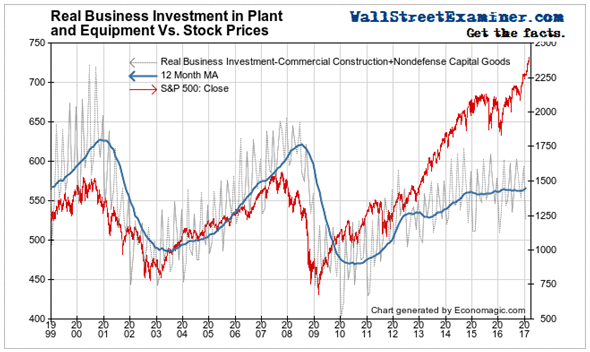
Meanwhile, as the stock market barrels higher, real business investment in plant and equipment has stalled (chart below). Bankers may be confident in their future prospects, but the biggest customers of the banks apparently are not. They are not investing in productive physical assets. The sharp slowdown in C&I loans also suggests that they have all but stopped doing financial engineering deals. That suggests that the stock market rally is running on fumes.
Meanwhile, as the stock market barrels higher, real business investment in plant and equipment has stalled (chart below). Bankers may be confident in their future prospects, but the biggest customers of the banks apparently are not. They are not investing in productive physical assets. The sharp slowdown in C&I loans also suggests that they have all but stopped doing financial engineering deals. That suggests that the stock market rally is running on fumes.
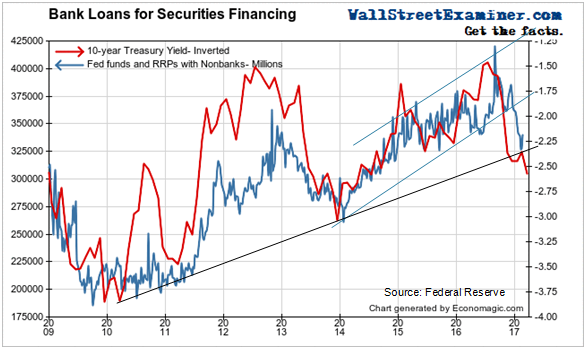
Loans on Securities – Repo loans to nonbanks to finance carry trades and other securities holdings have now broken a 3 year uptrend channel. They have been declining since they spiked to an all time high in mid September at top of the channel. They are now testing a 7 year trendline. If that breaks it would suggest the end of the speculative bubble, and the beginning of a bear market in bonds and stocks.
Meanwhile Treasury yields have broken a 7 year trendline after attempting to hold the line for several months. This is a bearish sign for the long term, both for bonds, and for stocks. In 1987 a bond market crash led the stock market crash by 5 months.
Funds trading volume is reported daily by the New York Fed and is real time. The daily chart has broken out from its year long range in recent weeks as the Fed has moved the Fed Funds rate higher. The Fed has signaled that it will do so again at the March FOMC meeting in a few days. This move will merely ratify an already tightening money market, as the payday loan aspect of the Fed Funds rate comes into play. This could be activity by US based subsidiaries of European Banks.
[Note: (1/13/16) While the Fed attempts to “control” the Fed Funds rate, it’s important to note that very few banks are borrowing in the Fed Funds market at all, and the ones that are do not represent the banking system as a whole, which is still awash in cash. The Fed Funds rate is, in effect, the payday lenders’ usury rate for those banks who are, in essence, living paycheck to paycheck.]Outside of the fake funds trading rate, none of these US commercial banking system indicators is yet flashing an outright sell signal. However, all of them are near enough to breaking their trends that those signals could come at any time. At this point, it’s week to week.
Follow Lee’s weekly market timing reports, including ETF trading recommendations, in the Wall Street Examiner Pro Trader Market Updates. Try the service risk free for 90 days.

