
“
In this past weekend’s newsletter, I discussed that the markets finally got a bounce as Mario Draghi announced the potential for more QE. To wit:
“Furthermore, with the markets VERY oversold currently, the expected bounce is likely starting now.”
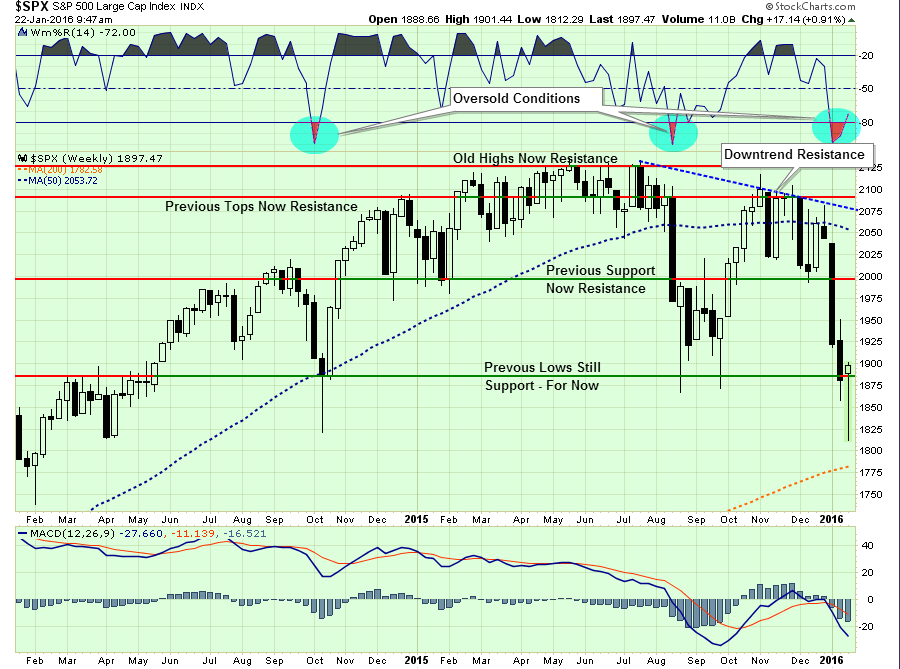
It is that very oversold condition that has continually suggested that something would happen to elicit a short-term retracement in the market. Not to be disappointed it was the promise of more liquidity by the ECB and Mario Draghi that elicited a massive short-covering rally on Friday.
With the Federal Reserve now heading into a two-day FOMC meeting, there are many hoping the Fed may come to the markets rescue. This could come in two forms:
- Discussion on pushing additional rate hikes out further into the year to evaluate the impact from China and the strong dollar on the economy.
- Potential for further accommodative action if necessary (QE-4)
Either insinuation will excite the bulls and create a rather significant short-covering rally in the short-term. However, such a rally would not change the ongoing deterioration in the underlying fundamental and technical backdrop. With price trends still primarily negative, it is still a “sell the rally” market currently.
The problem for the Federal Reserve is that they painted themselves into a corner in December when they hiked rates by saying:
“The Committee expects that economic conditions will evolve in a manner that will warrant only gradual increases in the federal funds rate; the federal funds rate is likely to remain, for some time, below levels that are expected to prevail in the longer run. However, the actual path of the federal funds rate will depend on the economic outlook as informed by incoming data.”
What they do on Wednesday will likely be a “make or break” moment for the markets. I would not be overly complacent about existing portfolio risk. However, with the markets deeply oversold, I do expect the short-term rally to continue for the moment.
The chart below identifies the potential retracement levels of such a reflexive rally. IMPORTANTLY, there is no guarantee that these mathematical retracement levels will be precise. These levels are a general AREA to begin rebalancing portfolio risk accordingly.
1970ish – Sell laggards and losers in portfolios.
(You know the one’s, the one’s you secretly keep hoping will come back.)
2000ish – Trim back winners to target levels
2030ish – Be at final risk-adjusted allocations.
NOTE: For conservative investors it is currently unlikely the market will rise much more than between 1970-1990 during this rally. I would do the majority of your portfolio rebalancing and risk reduction in this range.
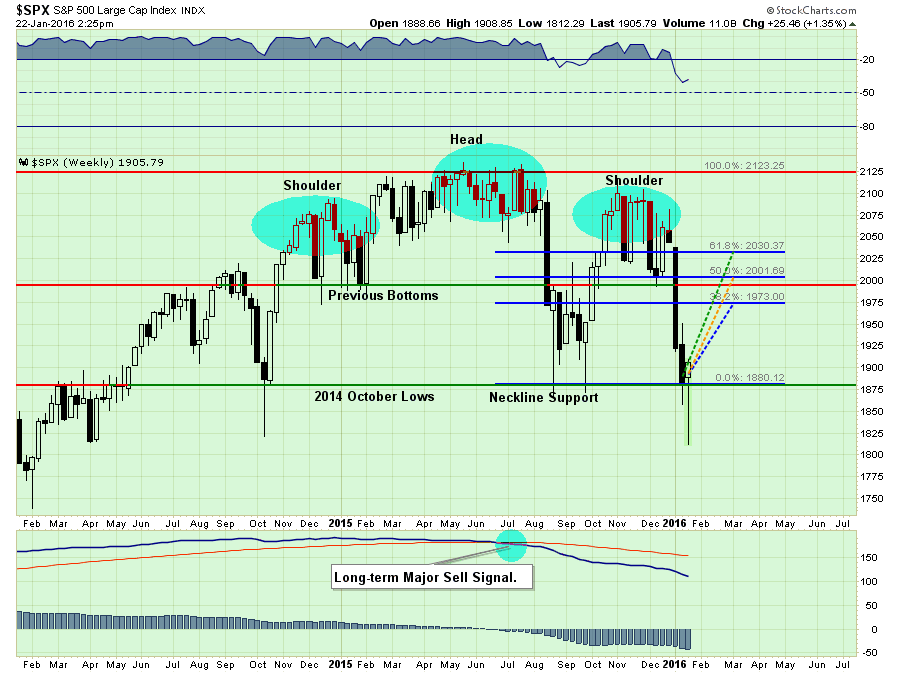
IMPORTANT: Notice the market has now traced out a fairly definitive “head and shoulder’s” technical pattern similar to that seen in 2008. If this rally fails, and breaks neckline support, the market will be in a confirmed bear market.
January Losses Lead To February Rallies?
It would seem logical that a weak performance in January would lead to some recovery in February. Markets are oversold, sentiment is bearish and February is still within the seasonally strong 6-months of the year. Makes sense.
Unfortunately, the historical data suggests that this will likely not be the case. The chart below is the historical point gain/loss for January and February back to 1957. Since 1957, there have been 20 January months that have posted negative returns or 33% of the time.
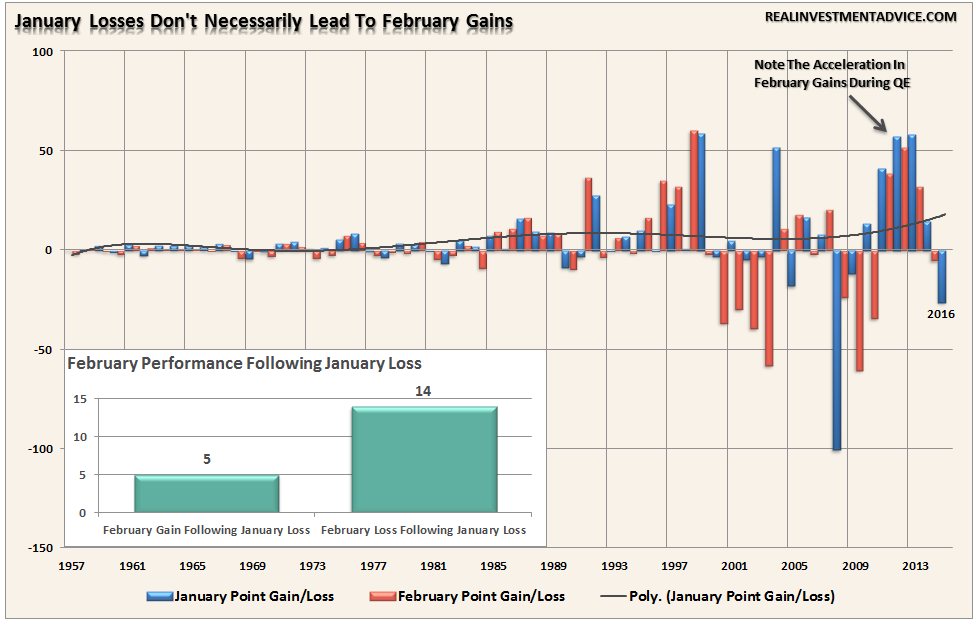
February has followed those 20 losing January months by posting gains 5-times and declining 14-times. In other words, with January likely to close out the month in negative territory, there is a 70% chance that February will decline also.
The high degree of risk of further declines in February would likely result in a confirmation of the bear market. This is not a market to be trifled with. Caution is advised.
S&P 500 Has A Strong Recession Prediction Record
The mainstream press has been publishing a good bit of commentary to support the “bullish” market calls of late by suggesting the S&P 500 has a poor track record of predicting recessions. To wit:
“The stock market sends a lot of false signals — there are 11 signals for the last six recessions.”
The problem is that the statement is not actually correct. The problem is in looking at historical data to come to that conclusion.
Looking backward, we now know the exact starting and ending periods of recessions. However, currently, we will not know the exact starting point of the next recession until at least 6-months after it has begun. This is because of the backward revisions to the economic data which is used by the National Bureau of Economic Research date the start of the recession. The lag between market declines, recessions and the NBER recession calls is shown below.
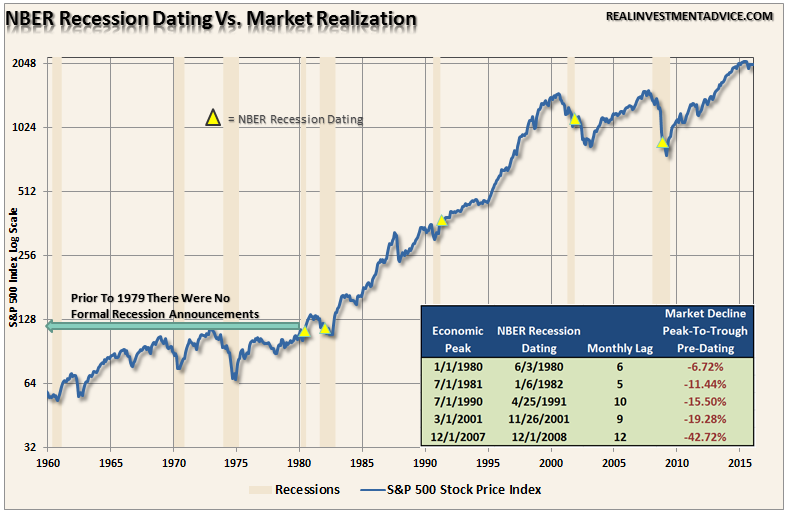
As you will notice in the chart above the S&P 500, with the exception of 1987, has declined in advance of the recession call in every case since 1980. (The NBER did not make formal recession announcements prior to 1979.)
However, if we look at the annual rate of change in the S&P 500 we also find a fairly strong predictive pattern of market prices and the onset of previous recessions. Going back to 1900 there have only been 10 cases where the YoY decline didn’t occur prior to, or in concert, with a recession.
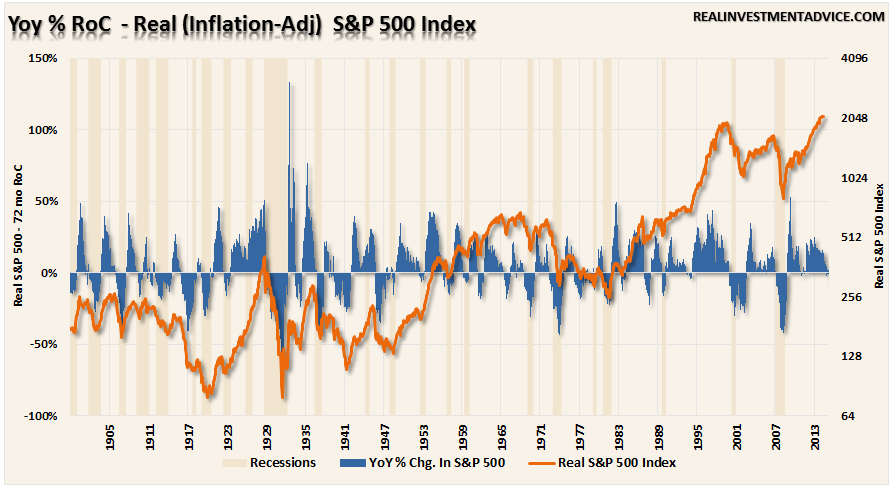
This only makes sense as market participants are operating on future expectations. The problem with suggesting the market is a horrible predictor of recessions is by waiting until the economic data is revised to expose the start of the recession, it will be far too late for investors to do anything about it.
With the year-over-year rate of change for the S&P 500 now negative, the question is whether this is one of the few times that it will be wrong? The market has a really good track record for sniffing out recessions. Unfortunately, until we get the revisions to the economic data later this year and next, we won’t know for sure. Are you really going to wait to find out?
Lance Roberts
Lance Roberts is a Chief Portfolio Strategist/Economist for Clarity Financial. He is also the host of “The Lance Roberts Show” and Chief Editor of the “Real Investment Advice” website and author of “Real Investment Daily” blog and “Real Investment Report“. Follow Lance on Facebook, Twitter, and Linked-In

