Maybe all the talk of a US manufacturing recovery that we have seen ballyhooed in the mainstream financial media the past couple of years can finally be put to rest. Mainstream media headlines reported that the top line number was down 0.2% in April. The report matched economists’ expectations.
That’s a month to month change on a seasonally adjusted basis(SA). The Census Bureau spun the report positively by noting that this followed 4 months of increases. “New orders for manufactured goods in April, down following four consecutive monthly increases,
decreased $0.8 billion or 0.2 percent to $469.0 billion, the U.S. Census Bureau reported today.” That claim is spurious because it is based on fictitious SA data, and not adjusted for inflation.
On the basis of actual orders, not seasonally adjusted (NSA), new orders fell by 9.5% month to month. April is always a down month, so a decline is not surprising, but the size of the decline is. It was worse than the April 2016 drop of 6.6%, and worse than the 10 year average April drop of 5.2%. In fact, it was the worst April since at least 2007.
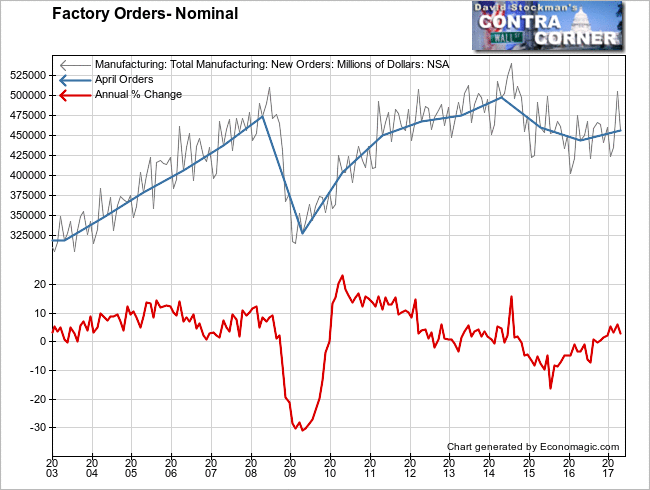
In all fairness, the calendar may have played a roll. There were fewer than normal business days in April. THe problem is that any adjustment for that would merely be a wild guess, because we don’t know how many orders would have been delayed from March or accelerated from May. We’ll just settle on the idea that it wasn’t a good month.
On a year to year basis, orders grew 2.9%. Sounds good right? Unfortunately, the data is in nominal terms. If adjusted by CPI the real gain was 0.7%.
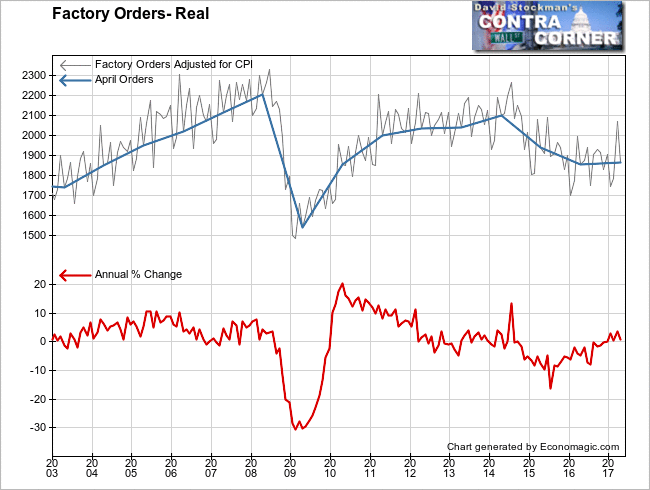
It’s pretty clear from that chart that the reported manufacturing recover didn’t happen. There has been some stabilization from a persistent decline, but orders are still below the levels of 2011-2015. Those levels are in turn below the levels of 2008, the year the Great Recession began.
The data includes non durable goods and durable goods. Non durables are goods that are consumed and replace. It includes such stable businesses as food processing, pharma, and oil and chemical refining for which demand is relatively inelastic. Durable goods are longer lasting goods that are generally higher priced and where demand is more elastic. Many durable goods require major investment and planning, such as capital goods.
Durable goods orders and stock prices have traditionally been correlated. But something has gone wrong over the past several years. Nominal durable goods orders and stock prices have traditionally moved in tandem. That relationship ended in 2014. Nominal durable goods orders, including price inflation have been declining since then, but stock prices have bubbled off into the stratosphere.
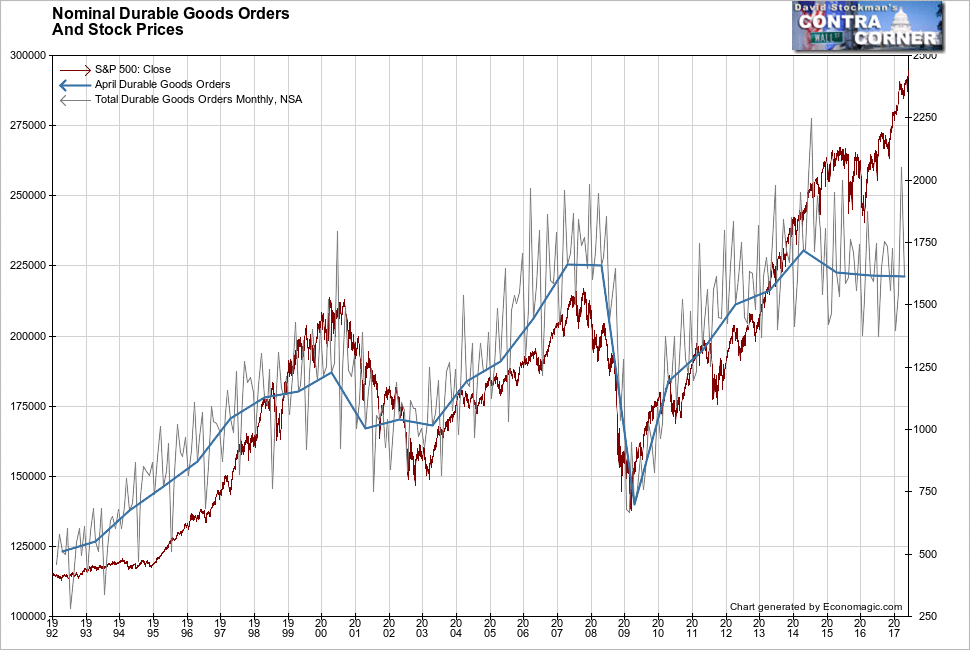
Nominal orders (NSA) were down 15% month to month in April. That compared with a 9.5% drop in April 2016, and a 10 year April average of -8.9%. It wasn’t good, but calendar factors again probably came into play. The obvious problem is the persistence of the weak performance over the past 3 years and the fact that stock prices have become divorced from that reality. Durable goods orders are below the levels of 2007 and 2008. Stock prices are more than 50% higher.
But it gets worse. Real durable goods orders, adjusted for inflation, have been in a downtrend since 2000. The annual growth rate has been persistently below zero since 2014. March was the first month that was more than nominally positive since mid 2014. But that was reversed in April. The annual rate of change slipped back to a decline of 2.3%.
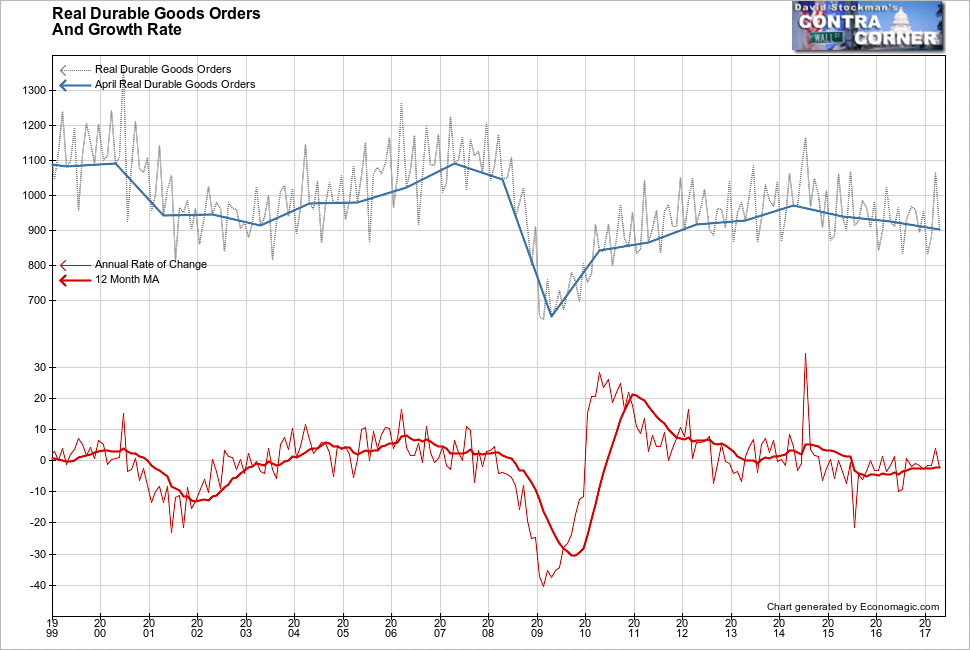
Looking at this data over the long run in comparison with stock prices creates a stunning picture. Real durable goods orders have been in secular decline since 2000. Meanwhile stock prices have found other reasons to go off into the stratosphere. We know that most of them aren’t good. They include central bank money printing (QE), zero interest rates (ZIRP), and the financial engineering schemes and wild speculation that those policies have engendered. The result has been a bubble with historically high levels of valuation, both of certain well known stocks, and for the market averages overall.
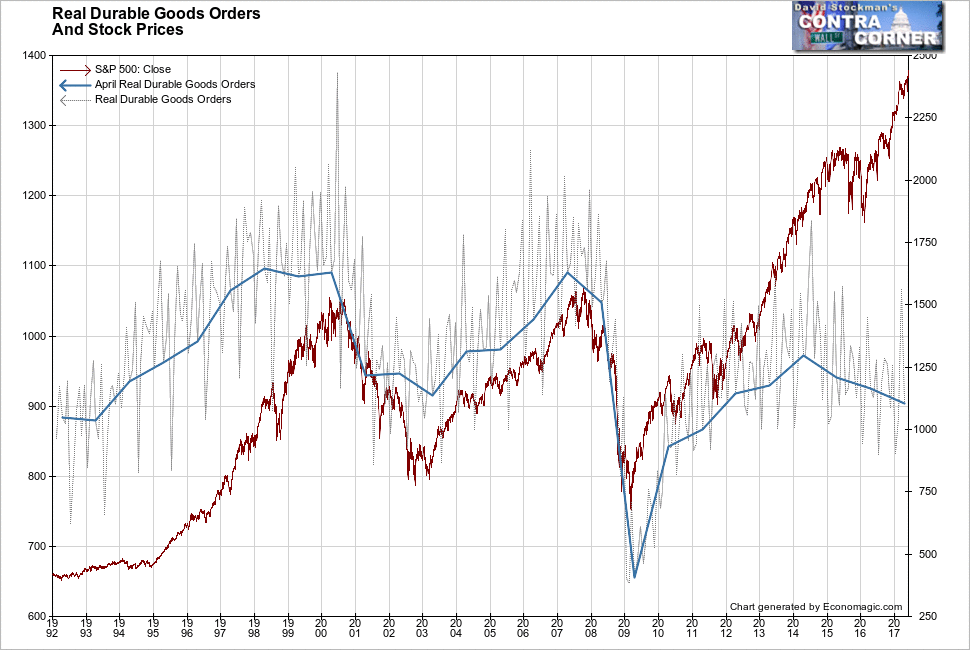
The above chart includes US government orders of defense capital goods, and the extremely volatile aircraft sector. This is known as core capital goods. When we subtract these orders from the total, the resulting net is a measure of business investment in capital goods. We would expect a strong correlation between investment in real capital goods, and investment in the corporations that buy and own those goods, in other words, in the stock market.
This is where any semblance of rational thought goes out the window. Core capital goods investment is now nearly 20% below the levels of both 2000 and 2007. Since peaking in 2013, these orders are now down by 11.3%. Stock prices are up 52%. Real core capital goods orders are down by approximately 17% since both their 2007 and 1999 peak levels. This has been an 18 year secular downtrend in core capital goods orders. Meanwhile stocks are up 65% from the 2007 peak.
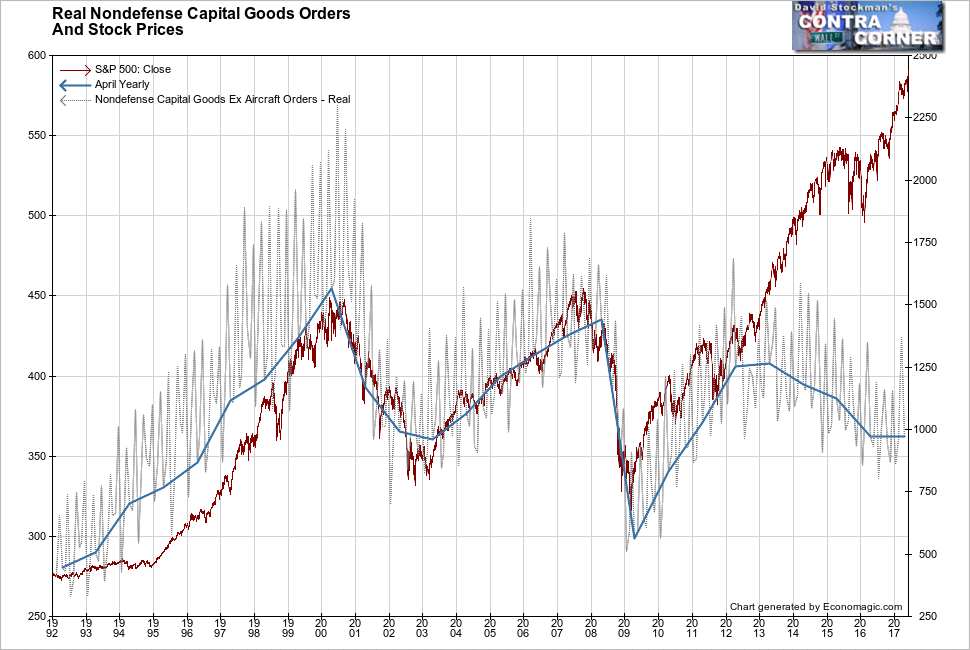
Both of those prior peaks were associated with massive bubbles. In 2000 it was the original tech and internet bubble. In 2006, it was the housing bubble. Business investment then rolled over nearly 2 years after the housing bubble reached its zenith, proving that they’re not always the best judges of the economy. In 2000, their investments peaked with the bubble peak.
But today something different is going on. Real core capital goods orders have been declining for 4 years. This lack of investment has been in spite of massive Fed QE and ZIRP. At the same time we have witnessed one of the biggest stock rallies of modern times. It’s not based on any real optimism about the economy among business people. Instead it has been driven by money printing and an absurd interest rate subsidy to giant leveraged speculators including both securities dealers and their hedge fund customers.
We all know that this won’t end well. Bubbles of this size and scope do not end with a central bank engineered soft landing. The only issue then is the timing.
Follow Lee’s weekly market timing reports, including ETF trading recommendations, in the Wall Street Examiner Pro Trader Market Updates. Try the service risk free for 90 days.


