
Along with the rest of the mainstream media, CNN is so deep in the tank for “Joe Biden” that it should change its call letters to DNC. So its not surprising the network spun yesterday’s flaccid GDP number into another attaboy for the puppeteers running the U.S. President’s teleprompter—pauses and all.
The US economy cooled more than expected in the first quarter of the year, but remained healthy by historical standards.
Then again, you might wonder which version of history they are referencing. If you look at the the 85 quarters since the turn the century outside of recession quarters, the real GDP growth rate exceeded the Q1 rate of 1.6% more than 80% of the time. And if you scroll back further to the period between 1954 and 2016, the real growth rate averaged 3.04% or nearly double the first quarter result.
Yet what is involved here is not merely a fact-checkers “Pinocchio” owing to blatant abuse of the actual historical facts with respect to the Q1 GDP print. The larger point is that the financial news has become so filtered and distorted by the recency bias of the MSM that the larger truth of the present has been totally suppressed and obfuscated.
To wit, at the core of modern capitalist economies—even with today’s so-called technological revolution—is the production of goods for household consumption and business investment. And yet the Fed’s own hundred year-old data series on that very matter—the industrial production index—says that the American economy has grown not a single inch since the eve of the Great Financial Crisis
The graph below is indexed to December 2007 =100.0, which is virtually identical to the level posted for March 2024. The real economic story of the moment, therefore, is that even as the official GDP measure continues to pound out tepid gains, the manufacturing, mining, energy and utility producers of the US economy have been spinning their wheels to nowhere for the past 17 years.
Industrial Production Index, December 2007 to March 2024
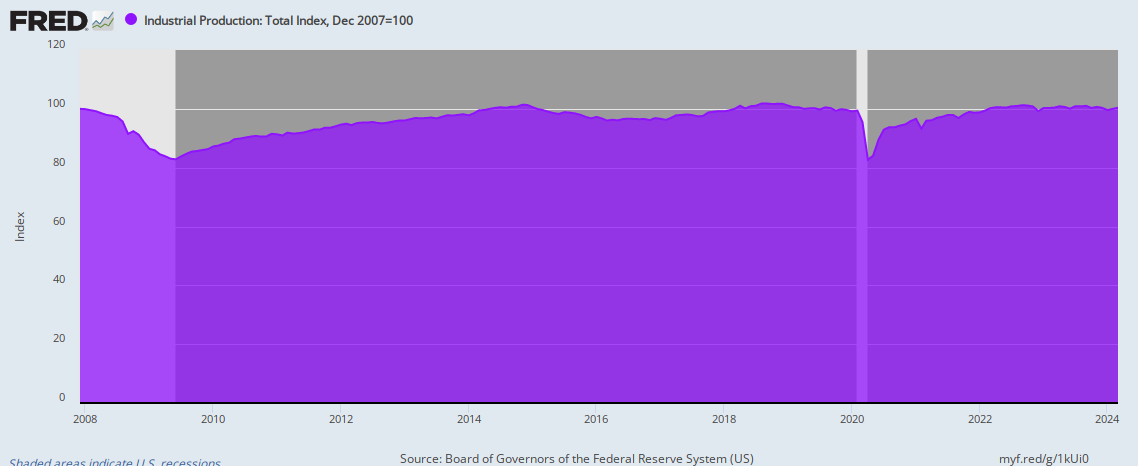
Needless to say, this flat-lining trend is the very opposite of prior history. The same index rose by 630% between January 1950 and December 2007. That’s 3.5% per annum for 57 years running. And that happened notwithstanding nine recessions, a wide range of Federal fiscal, monetary, regulatory and tax policies that were good, bad and indifferent, and also numerous political crises from the Cuban missile crisis, to oil embargoes, the Persian Gulf wars and 9/11.

