
In a vintage display of excuse making, the Wall Street Journal went off the deep end last week trying to justify and deny just how terrible the new home sales headline number was.
They started on the right foot with their headline:
U.S. New-Home Sales Fall in October
Purchases of new single-family homes dropped 1.9% from September and were well below estimates by economists
Even the lead-in was headed in the right direction.
Sales of newly built homes edged down in October, a sign the housing market could be losing momentum in the closing months of the year.
But it was all downhill from there with the denialism.
…Despite the slowdown from the summer, sales have been stronger in the later months of the year than in the first quarter…
…Through the first 10 months of the year, sales were up 12.7% compared with the same period in 2015. That measure was more consistent with other gauges of the housing market showing improvement through most of this year…
…New-home sales account for a small slice of U.S. home-buying activity, and sales data can be extremely volatile from month to month. October’s decrease from the prior month came with a margin of error of 13.1 percentage points…
…The slight uptick in inventory suggests home builders are responding to sustained demand, which pushed down supply in recent months and raised prices….
…The median price of new homes sold in October was $304,500, up from $298,700 a year earlier…
…To some observers, that suggests the housing market will continue its recovery…
…“Home sales are well-positioned for sustained growth in the year ahead,” said Brittany Baumann, macro strategist at TD Securities Inc….
… [Mortgage] rates remain near historically low levels and barring a significant move higher, sales activity should remain supported by ongoing job growth, rising incomes and a further pickup in single-family residential construction,” she said…
There you have it, all the possible excuses the Journal could come up with, although it did add a few statements on the other side of the ledger.
In the Department of How Bad Was It, let’s compare the seasonally adjusted poppycock with the actual data. The Journal and all other mainstream media report only a seasonally adjusted annualized figure for the month. That multiplies by 12 any statistical error, seasonal adjustment error, or other anomalies in the data for the month. The chances are therefore pretty high that the reported number misrepresents reality.
Therefore, I analyze only the actual, not seasonally adjusted data. The less the massaging of the number, the more likely it is that we will be able to see the trend clearly. I also want to gain perspective on the trend by looking at a much longer period of time than the media reports. They typically look at only the current cycle. We want to see how the current cycle compares with past cycles.
Before any seasonal finagling, there were actually 45,000 new houses sold in October. That’s up 6,000 from October 2015, which is actually pretty good. It equates with a 15.6% increase from year to year. Apparently, the sky isn’t falling… Yet.
Month to month, there was no change from the September sales. Since 2013, October has had an increase of 1,000 to 5,000 units. So on the one hand, year to year momentum looks relatively good. On the other hand the month to month change shows weakening momentum.
The fact that the seasonally adjusted number missed the consensus guess of mainstream economists is meaningless. There’s no material change in the actual trend. However, there’s a hint of weakness in the month to month data. And mortgage rates, which had been a significant long running tailwind are now a headwind.
One month does not a trend make. We can look at quarterly data to see if this month to month slowing is something new or not. Using the most recent 3 months versus the same period last year we see year to year growth at a stunning 19%, which could be evidence of a blowoff. But on the the basis of comparing consecutive 3 month periods, sales fell by 4,000 units. That’s significantly worse than any quarter since 2009, when the housing market was still in teeth of its massive collapse.
On the whole, the uptrend still appears to be intact, but that was with the help of mortgage rates of 3.5% or less in the period from July to October. That was Nirvana. The market is now at the Gates of Hell, with rates skyrocketing in recent weeks to over 4% and looking like they’ll head higher as they have lagged soaring Treasury yields. Those buyers who were on the cusp of qualifying to buy at a rate of 3.5%, no longer are. Sales for November should show a significant falloff.
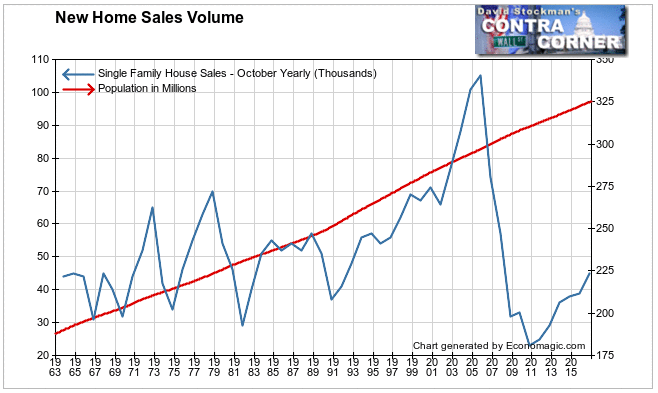
In order to keep this “powerful” recovery in perspective, here’s a chart of the very long term, starting in 1963 when the government first started collecting this data. You can see that at current levels, total sales are only around the level of the earliest stage of the rebound from George Bush, the Elder’s recession in 1991. America has 75 million more people now than it did then. That’s an increase of around 33%. But new home sales are no higher today than they were then. Even the rate of increase looks sluggish versus past rebounds. So much for the vaunted recovery.
In the short run, the trend is the thing. The October data only hinted that that trend was beginning to fray around the edges. But that was with the tailwind of record low mortgage rates. That party is over. The November data should show that.
There’s a treasure trove of additional data in the Commerce Department’s New Home Sales release. I’ll delve into that a little in the days ahead. It’s a depressing picture that points to a grim future. Stay tuned for the next update.
Lee Adler first reported in 2002 that Fed actions were driving US stock prices. He has tracked and reported on that relationship for his subscribers ever since. Try Lee’s groundbreaking reports on the Fed and the Monetary forces that drive market trends for 3 months risk free, with a full money back guarantee. Be in the know. Subscribe now, risk free!

