
Last week the Commerce Department released December housing starts data showing a big increase in the headline numbers. These numbers represent a flawed, seasonally adjusted impression of reality. But they suffer from a bigger problem. They combine data from two fundamentally different industries, single family housing development and multifamily development. Single family constitutes the bulk of the market, with about 2/3 of the market. Even though multifamily is smaller, it sends important signals about the state of the economy and deserves a closer look on that basis.
I discussed the differences between the two industries in a prior post.
Single family starts reflect purchases and custom builds, in other words, major long term financial commitments by families and households.
Multi family starts involve mostly the construction of rental units. Renters are typically people who cannot afford to buy, or secondarily who do not want to make a long term commitment to a specific home. They haven’t been sold on the American dream of being a mortgage slave.
Developers are building these units for investors not homebuyers, and certainly not for the users of the product. Buyers of these properties are driven by current yield, and income growth potential, not whether they would want to live in the property.
The single family market is the more important of the two businesses, but the multifamily market can also send important signals. Multifamily housing developers may respond more quickly to changes in financial market or housing market conditions than the single family market. Economic and financial considerations are paramount in the multifamily market. The single family market tends toward decision making driven by emotion.
First let’s examine December’s multi-family data to see if it is telling us anything important this month. I’ll go over the single family data in a subsequent post. Rental apartment construction represents over 90% of the multifamily development business. Condos constitute less than 10%. So these numbers are about the rental market.
The Wall Street Journal did not report on the monthly data. It reported that on an annual basis multifamily starts fell by 3.1% in 2016 versus 2015. I have confirmed that figure, and I think it’s salient. Developers started fewer units in the last 12 months in spite of record low mortgage rates. It suggests that renter demand is softening and that rent affordability may be becoming an issue.
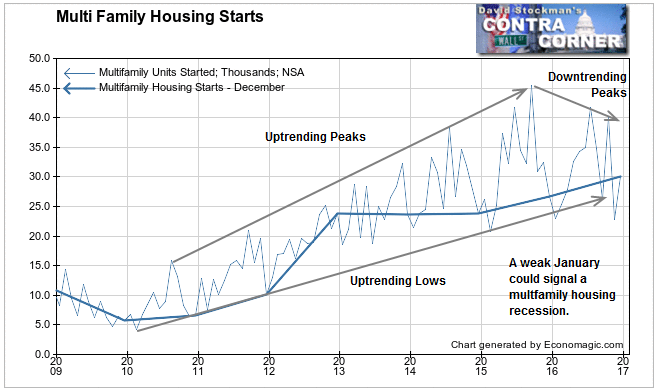
On an actual, not seasonally adjusted basis, starts rose in December. They were up 7,300 units from November, an increase of 32%. That’s extremely unusual for December. Usually December starts are lower than November’s. Over the past 10 years December starts have dropped an average of 15% from November. In 2015 the drop was nearly 18%. The only other December increase was in 2012, when multifamily starts rose by 2,500 units, or 11.7%. The current month was a real outlier.
On a year to year basis December 2016 was up 12.7% from 2015.
All of that sounds great until we consider what happened in November. Starts were down 43.3% month to month and 29.8% year to year in November. It was worse than any November since 2006, by far. So December’s gain was a correction of the extremely low number of starts in November. It was most likely a problem with the data, rather than the market itself. In either case we can get a clearer picture of what’s going on by looking at the 2 month change. December starts were down by 10,000 units from October. That’s exactly the same as the December-October 2015 change. There’s nothing new in the current data. There’s no indication of unusual strength. We can put that idea to rest.
Moreover, the recovery trend since 2010 appears to be broken and in the process of reversing. A weak January could signal a recession in the multifamily development business.
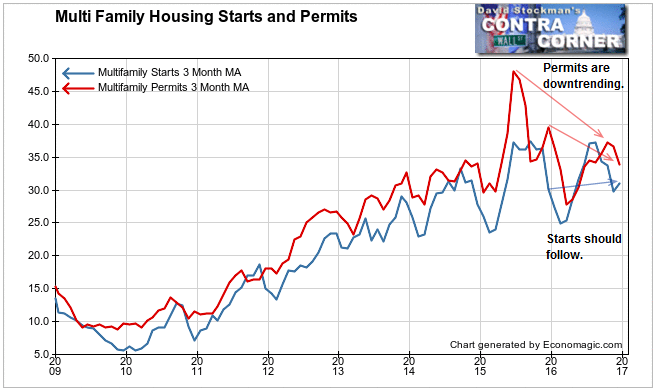
We can filter out the extreme month to month volatility of this series by using a 3 month moving average. It’s clear that there has been a slowdown since 2014, but not yet a downturn. However, overlaying the 3 month average of multifamily building permits gives us an important insight. Permits clearly peaked in 2015 but most of the units permitted in the mid 2015 spike were never started.
That was probably the peak of the boom. Permit issuance then broke the recovery uptrend in 2016, falling below both the 2014 and 2015 lows. At the same time permits made lower highs in late 2015 and October 2016. The 3 month average as of December was down about 13% from the same period of 2015. These are bearish signs.
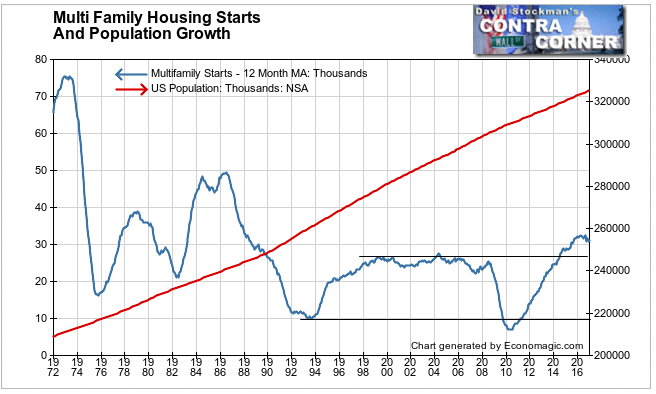
Taking a long term perspective 12-month average multifamily starts have exceed levels going back to 1988. They remain well below the demographic peaks of 1972-73 and 1984-86. Considering how much population has grown since 1973, the number of new housing units being built looks pretty punk on a long term basis. This is a demographic issue.
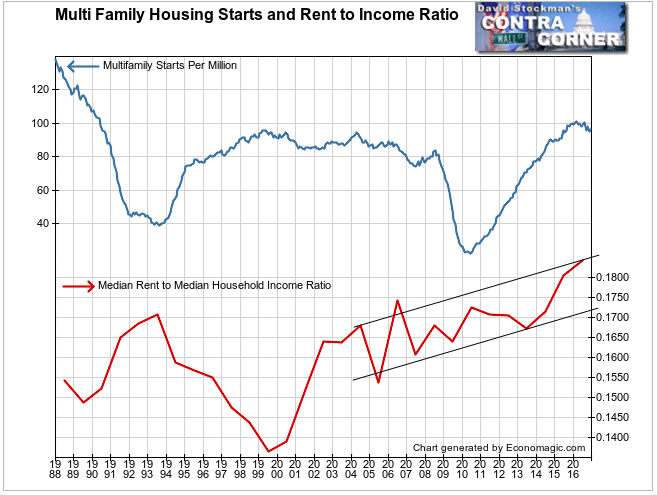
Another way t0 look at that is on the basis of starts per million of US population. The long term trend becomes clearer. The number of units built per million people remains at half the rate of the mid 1980s. Since the 2008-09 recession, the starts rate has recovered to the 1999 peak level, but has stalled there. This recovery came with the stimulus of constantly falling and record low mortgage rates. What happens when interest rates for construction loans and permanent mortgage financing rise?

Multifamily construction seems to have reached the limits of what the traffic will bear. Rents have risen too far too fast, and rent affordability has become an issue. The median monthly rent has now risen to 18.5% of median monthly income. That may not sound like a lot, but it represents the nationwide median, including both high cost and low cost markets. In some high priced metros, many households are spending up to 50% of their income on rent. The current median ratio of 18.5% is the highest rate since this data has been available. The ratio has also reached the limit of the uptrend that began in 2004. Apartment demand has probably reached its limit as a result.
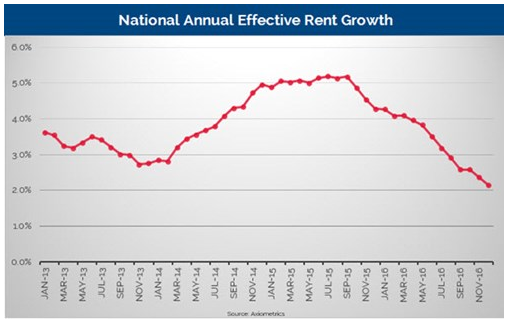
So, it’s no accident that multifamily development has stalled. Multifamily housing research firm Axiometrics reported that nationwide December rent inflation fell to just 2.1% year to year in December. This is down from a persistent 5% in 2014-15. That can’t be sustained when wages and salaries are growing by 2% or so. Current rent inflation was the lowest since 2010.
Axiometrics also reported that nationwide occupancy fell to just 94.3%. That was the lowest December since 2013, with January, the weakest month of the year still ahead.
Slowing rents and falling occupancy are hardly a sign of a healthy housing market. These trends are likely to induce builders to cut back production in the months ahead as they respond to the slow deterioration in the housing development cycle. These trends in the boom-bust multifamily housing cycle take years to develop. However, once the cycle rolls over the bust is typically sharp and disruptive to the economy as a whole. If interest rates rise, that will only exacerbate the downturn that appears to lie just ahead.
Lee Adler first reported in 2002 that Fed actions were driving US stock prices. He has tracked and reported on that relationship for his subscribers ever since. Try Lee’s groundbreaking reports on the Fed and the Monetary forces that drive market trends for 3 months risk free, with a full money back guarantee. Be in the know. Subscribe now, risk free!

