Actions speak louder than words. What’s the point of asking consumers their opinion of the economy when we can judge by their actions, their actual monthly purchases of retail goods. The Census Bureau samples that behavior each month. The retail sales figures are the best barometer of consumer attitudes about the economy. Moreover, they are the best measure not only of attitudes, but also consumer wherewithal. If consumers have the means, they’ll spend. If they don’t, they won’t. And if they don’t, they’ll probably feel lousy about the economy. It all shows up in the retail sales numbers.
But to get to the truth, we must dig below the topline numbers. This month the mainstream media wrung its hands that retail sales had fallen in March. But that was based on the Seasonally Adjusted (SA) nonsense numbers. The actual, not seasonally adjusted numbers showed that March wasn’t nearly as weak as the headlines said. In fact, it wasn’t weak at all. Apparently consumers at the top of the wealth and income spectrum looked at their stock market gains and went on a spending spree. For the average Joe, things were as tight as ever, but as long as a few wealthy people are spending a lot, that skews the top line numbers upward.
These numbers are not adjusted for inflation. Back that out and look at the trend in a long term context, and the embedded rot in the US economy becomes apparent. In the end, the media’s consternation over weak sales is well founded, even if they’re looking at bad data.
The Census Bureau reported last week that:
Advance estimates of U.S. retail and food services sales for March 2017, adjusted for seasonal variation and holiday and trading-day differences, but not for price changes, were $470.8 billion, a decrease of 0.2 percent (±0.5 percent)* from the previous month, and 5.2 percent (±0.9 percent) above March 2016.
The Wall Street Journal and the rest of media crowd, gnashed its teeth over that.
But note that in its press release, the Census Bureau told us that the margin of error is ±0.5 percent. In other words, when more March sample data has been crunched for the next monthly release, that -0.2% could turn into as much as a +0.3% gain. For example, the advance number for February was an increase of 0.1%. That was revised this month to a decline of -0.3%. January was originally reported at +0.4%. It was revised to +0.6%. In addition, the Bureau also tells us that it has an:
Intention to Revise: Monthly retail sales estimates will be revised based on the results of the 2015 Annual Retail Trade Survey. Revised not adjusted estimates and corresponding adjusted estimates are scheduled for release on April 26, 2017 at 10:00 a.m. EDT.
That means that most, or maybe even all of the monthly data from the past year will be different from what was originally reported, both in the advance and revised number. Of course, virtually no one will pay any attention to the corrected data, just as no one pays any attention to the direction of the revision each month. No one remembers or cares what the advance estimate was in the month before. The advance numbers right this moment are Wall Street’s holy grail. It’s nonsense, but traders have short attention spans. They need an excuse du jour. The current release is it. The past doesn’t exist.
As always, our interest lies in the actual data, not seasonally adjusted data. True, that also gets revised each month as more data comes in, but we’re more interested in how the trend behaves over time. The month to month changes are essentially noise. But when the data is charted both in raw form and as adjusted for inflation and population growth, we can get a good handle on the real story instead of the usually misleading headline narrative.
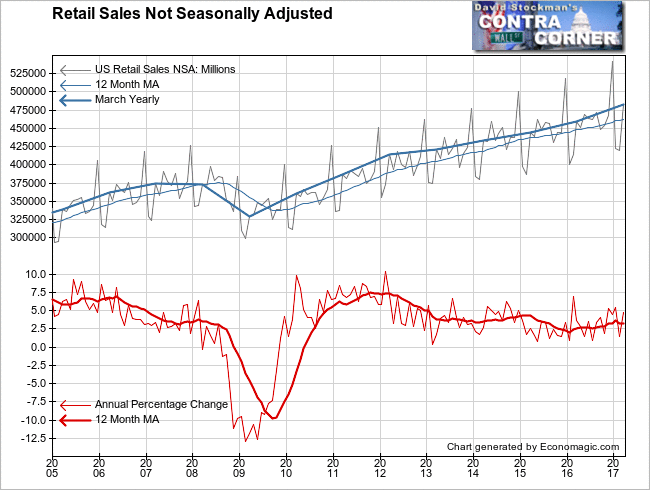
The raw data, including inflation, showed an increase of 14.9% in March. March is always an up month. The average March increase over the prior 10 years was 12.8%. Contrary to the headlines, March was not a weak month, at least in the advance data. In fact, this March was the strongest March since 2010. The headline number reported by the mainstream media was just flat out wrong.

The trend looks solid, but it includes inflation. The data is in nominal dollar terms, not inflation adjusted unit volume terms. The nominal annual growth rate in March was 4.8% (not 5.9% as the headline number showed). But the growth rate is volatile month to month, swinging up and down each month like clockwork. The 12 month average of nominal growth is around +2.6%.
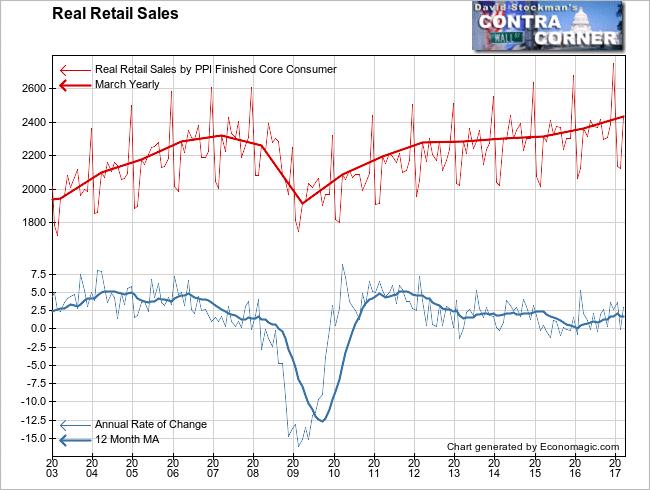
Adjust for inflation and suddenly that trend doesn’t look so hot. The 12 month average real growth rate is currently at +1.3%. It’s not recessionary, but it is hardly robust. And it is within a trend of gradually slowing sales growth since 2011.

Ironically, sales growth has actually upticked a bit since the Fed began nominally raising interest rates. That’s not surprising. Consumers initially increase their spending when they expect interest rates to rise. That trend obviously can’t be self sustaining. It is merely borrowing from future sales. The next time the growth rate turns down, it’s likely to fall into negative territory. I can’t predict where the tipping point when the growth rate turns negative will be, but we’ll be on the lookout for it.
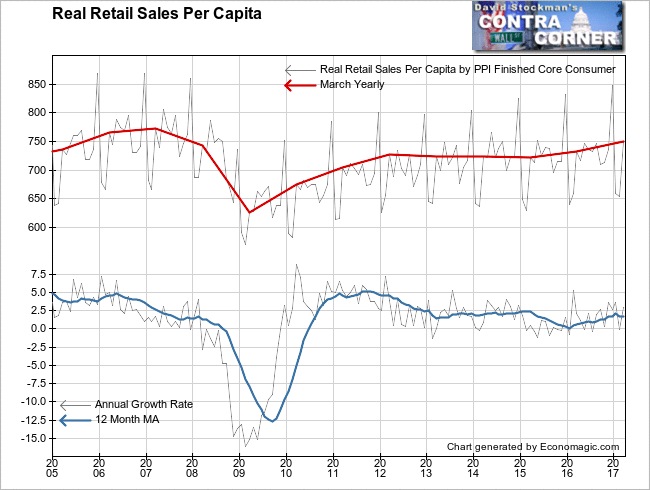
Real retail sales are now 4.7% above what they were 10 years ago at the precipice of the Great Recession. That’s an average gain of less than a half percent per year. That’s less than population growth. Real sales per capita are still below what they were 10 years ago, in spite of a massive spending party by those of us fortunate enough to be in the upper income strata. Most people are buying less than they could and did in 2007.

I’ll close with a couple of factoids about sales of necessities. Those are items like food, fuel, and clothing, that are everyone’s lowest common denominator. The wealthy don’t buy much more of those items than do the rest of us. From March 2016 to this March nominal grocery store sales rose 1.8%. Take out inflation, and that number goes negative. Since population has grown by nearly 1% in the past year, it’s clear that on average, people are buying less food!
Clothing store sales rose actually fell in nominal terms by 2.5% over the past year. Adjust for inflation and that becomes a 4.5% drop. People are buying less clothing!
Finally, gasoline sales rose by 14.5% in total dollars. But the BLS says that the price of gas rose by 20.2% over the past year. That means that drivers bought nearly 6% less gas than a year ago. These are the basic necessities of life. American consumers are buying less of them! If these are the good times, what will bad times look like?
Follow Lee’s weekly market timing reports, including ETF trading recommendations, in the Wall Street Examiner Pro Trader Market Updates. Try the service risk free for 90 days.


